Using MIPAV for astronomical image processing
If we look at image processing from the mathematical perspective, all digital images (no matter how they were acquired) are just arrays of numbers that can be manipulated by image processing software. Across different fields of study, image processing applications, however developed for very specific needs, often use similar routines based on common image processing algorithms.
Contents
Introduction
MIPAV is a very flexible image-processing package. It is platform-independent and free. Although it was intended for medical image processing, it also supports various non-medical imaging formats including FITS, which is used in astronomy. The software has a particular emphasis on image analysis and offers a number of tools for data reduction and image calculation, which can be used in deep sky and planetary imaging. MIPAV has a well-developed “plugin” interface, that allows users to write their own plug-ins. MIPAV has a very active user community that already contributed many freely available plugins, some of which are very useful for astronomy.
Why astronomy?
The following features makes MIPAV a good choice for use in astronomy:
- It supports both FITS and raw formats, as well as many others including TIFF, JPEG, etc.
- It has an extensive used documentation in a form of public wiki including instructions for beginners, advanced users and tutorials.
- It is free.
- One can write one’s own plug-ins.
- MIPAV algorithms are more mathematically “transparent” than those used in commercial packages such as Adobe Photoshop or MaxIm DL.
- MIPAV keeps the image provenance information in the .xmp files (which is an XML format file). The .xmpl file has the same name as the image file and it keeps a log of all transformations performed on the image, including time, date, algorithms used and parameters applied and even transformation matrices. I found this very helpful.
Topic outline
This topic will outline the technique that can be used for processing galaxy images. MIPAV algorithms are used for both astronomical data reduction and for making “pretty pictures”. Two case studies are presented.
Case study 1 shows how to use MIPAV to reduce the galaxy photometry data from the given sample of multi-band image of M63 – the Sunflower Galaxy from the McDonald Observatory. The raw images were combined into 3-color images of M63. The image processing includes noise reduction, cropping, scaling, alignment, and creating a single multi-color image of a given galaxy. The result is compared wither result received from processing the same set of data in MaxImDL.
Case study 2 - TBD.
Case study 1 - M63 image processing in MIPAV
Data files - TBD.
Image processing log
1. Open bias, flat and science images. MIPAV automatically recognizes FITS images. To open RAW images, specify the image dimensions (2080x2048), bin information and image type which should be USHORT or better ARGB_ushort . 2. Removing overscan regions from all images including bias, flats and science images. Use Crop Using Boundary Parameters tool to crop 20 pixels overscan from the right side of each image. Save images in FITS format. 3. Create the master bias frame by combining several frames into a single master bias frame. Use the Image Calculator Bulk Images- Average algorithm. The algorithm assumes that the noise in the images is uncorrelated and has a zero average value. Save images in FITS format. 4. Subtract the master bias frame from all flat frames (B fats, V flats and R flats). Use the Image Calculator-Subtract algorithm. Saving these (flat-bias) images in FITS format. 5. Create a master flat frame for each filter images (Bs, Vs, and Rs). In this data set we have 5 flats from each filter, in order to create the master flat, we need to calculate a mean value image from all (flat-bias) images for each filter (R, B, and V) from the previous step using the Image Calculator Bulk-Images advanced option. Saving result master flats for each filter in FITS format. 6. Calibrate all science images using the following equation (science image from the specific filer (R, B, or V) – master bias)/(flat of the same filer-master bias). Use Image Calculator to perform this operation for each science image. Save calibrated science images in FITS format. 7. Manually remove bad pixel(s) from each calibrated science image. This could be done by using the Paint tool. Use the Paint to highlight “bad” pixels and then use Paint to Mask option to convert a painted region to a mask. The tool allows to use eyedropper to set the pixel intensity value or to manually enter the desired intensity value (e.g.the mean value from neighbor pixels). Save improved science images in FITS format. The same operation can be also done by using the Replacing pixel value tool. 8. Co-align the calibrated science images from each filter: first all R (2 images), then all B (2 images) and then 2 V images using the Landmark Least Squares algorithm - the algorithm provides a way for registering an image to the reference image by using corresponding points (stars) placed in both images. I used 3 stars as points of references. This algorithm registers images that require rotation and translation. Save images in FITS format. 9. To reveal fine detail apply the Unsharp Mask algorithm to each science image. Although the photometry is not preserved, unsharp mask is a very effective tool for extracting fine detail in deep sky images. It makes sense to perform the unsharp mask filter on the individual science images before combining them into the final image. This technique allows the harder unsharp mask filter to be used initially. By combining the images afterwards, the effects of the filter are averaged out and the final result looks more natural.
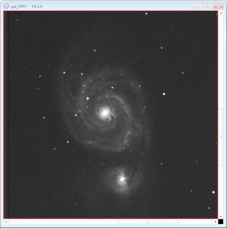
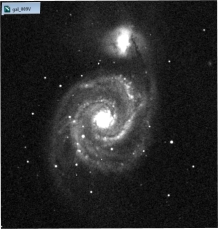
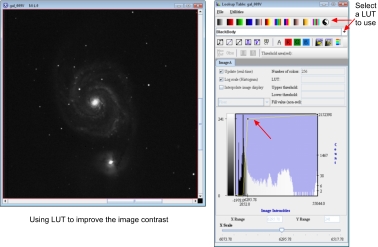
10. Stack the co-aligned science images from the previous step, use the Slice tool to create a single stacked image from each science dataset. Another option is to create a single science image for each filter by adding each pair of science images using the Image Calculator Add tool. This will also create an enhanced image.The result M51 V image processed in MIPAV and MaxImDL ver 5 is shown on your right. Note that MIPAV image has a different orientation, but that could be corrected by editing the image attributes via Image Attributes dialog box. 11. Improve the result image contrast using the Look up table tool. Lookup table (LUT)- maps the frequency distribution in a histogram to pseudo-color values. In MIPAV, a look up table plays the role similar to stretching in MaxImDL. It allows to remap the original intensities to monitor intensities or to other intensities. LUT indicates what number is to be substituted for each pixel value during the processing of the image, however processing with a LUT does not change the image. One of the advantages of LUT digital processing is that the processing parameters (factors) can be selected to produce images with contrast characteristics need. For more information, refer to Changing Image Contrast topic of this WIKI.
12. Combine science images using alphablending. To compare galaxy image taken through different filters, one can load 2 science images (e.g. B and R or R and V, etc.) in the same image frame and then compare them using either LUT or Alphablending. MIPAV alphablending is a technique that adds transparency information to translucent objects. When two images share the same frame, one can adjust the alphablending settings so that to see a blend of both images and can compare overlapping regions in two datasets. The level of translucency for one image is inversely proportional to the other.E.g., if image A is 75 percent transparent (25 percent opaque), then image B is 75 percent opaque (25 percent transparent).
From step 1 to step 12 I was very pleased with results. However, when I tried to convert grayscale images to color ones using the Gray to RGB conversion tool, it did not work very well ). The problem is I believe that when MIPAV does the gray to RGB conversion it truncates intensities to 0-256 range, which is not enough for astronomy (it works well with planetary images though, when I tried Jupiter images). I need to investigate this further.
I transferred grayscale science images processed in MIPAV to Adobe Photoshop and created the final “pretty picture” color image using Adobe Photoshop CS6.
The bottom line is that one can use MIPAV to process grayscale deep sky images and it works well. When one needs to do the final step and create a beautiful multi-color image, one can save MIPAV images as raw files or 16 bit TIFF files and proceed further with Photoshop or PaintNet (this one is free).


