Displaying images using the default view
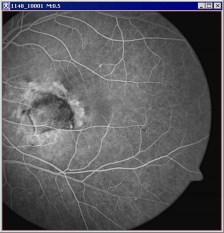
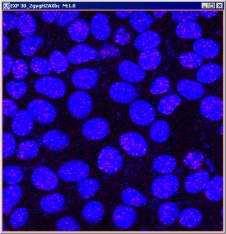
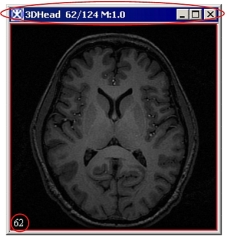
In the default view, MIPAV displays the images in a dataset one at a time in an image window. This window can display datasets of any dimension.
Images open in the default image windows
|
|
|
Selecting views
A view refers to the way an image file is displayed. A view indicates how many images are shown at one time and whether images are advanced manually or automatically. Depending on the view, the size and shape of the image window in which an image is displayed can vary.
This page explains how to display image files in the default, lightbox, and cine view, however, MIPAV allows you to display images using other views also.
MIPAV views
|
Icon
|
View
|
Icon
|
View
|
| Default | Surface plotter | ||
| Animate | Volume renderer | ||
| Cine (movie) | Tri-planar | ||
| Lightbox | Tri-planar dual | ||
| Link to another image |
|
Volume Tri-planar |
Displaying images using the lightbox view
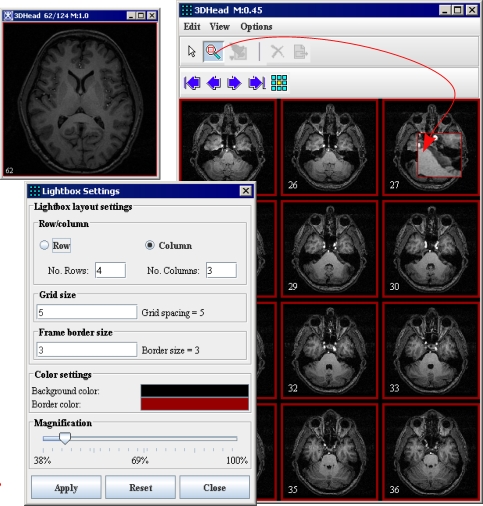
The lightbox view is similar to the default view, except that all images in the dataset appear in one window at the same time.
To display images in the lightbox view:
- Open an image file. The image appears in an image window.
- Select the image window. Do one of the following in the MIPAV window:
- Click the View Light Box icon;
- Select Image > Views > Light box.
- The image now appears in a lightbox view.
- Select Options > Settings in the lightbox view window to adjust the size and shape of the window. The Lightbox Settings dialog box opens.
- In the dialog box, indicate the number of rows and columns, the grid size, frame border size, color settings, and the magnification.
- Click Close when complete. The image appears in the lightbox view.
To magnify a portion of the image in the lightbox:
Click Magnify Region and move the pointer to the image section to be magnified. Click Default Mode when finished. Double-clicking an image in the lightbox view updates the 2D image frame for that image.
Displaying images using the cine view
When you view an image file in cine view, MIPAV automatically advances images one frame at a time. The effect is much like a film loop.
To display images in cine view
- Open an image file. The image appears in the default image window.
- Select Image > Views > Cine (Movie). The images in the image window are advanced automatically.
Adjusting magnification
MIPAV allows you to magnify images from 1.5 to 32 times the size of the original image. Using the magnification tools, you can magnify or minify the entire image or just a portion of the image. Much like a traditional magnifying glass, the magnification box can also minify-or reduce the level of magnification-a portion of the image.
Magnifying images
To magnify an image, click the Magnify Image icon, and then click the image. Each time you click the Magnify Image icon and click the image, the image doubles in size. If an image is too large for the current window size, scroll bars appear, and you may need to manually adjust the size of the window.
Reducing the magnification level
To reduce the magnification level of an image, click Minify Image. Each time you click the Minify Image icon, MIPAV reduces the magnification level of the image by half.
Restoring the original level of magnification
To return the image to its original size or original level of magnification, click Original Magnification.
Magnifying regions within images
![]() The Magnify Region icon allows you to view a square portion, or region, of the image at a specific magnification level. If you have loaded two images into the same image window, the Window Region of Image B icon appears on the toolbar. Use this icon to view a region on the second image, or Image B.
The Magnify Region icon allows you to view a square portion, or region, of the image at a specific magnification level. If you have loaded two images into the same image window, the Window Region of Image B icon appears on the toolbar. Use this icon to view a region on the second image, or Image B.

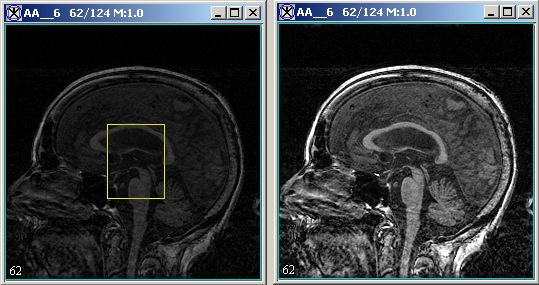
To use Magnify Region
- Open an image.
- Click Magnify Region and move it over the image. As you move the mouse over the image, the Magnify Region icon displays a magnified square region in the image in a red box. The number at the left corner of the square is the magnification level.
- You can change the size of the magnifying region to allow you to view larger or smaller regions of the image.
- Right-click on the image while displaying a magnified region. The Magnification dialog box opens.
- Type either a higher number for a larger region or a lower number for a smaller region in the Width box. Valid values range from 64.0 to 198.0.
- Click Apply. The size of the magnified region, or square, either increases or decreases in size. Changing the magnification level of the magnified region works similarly to changing the size of the magnified region.
|
Magnification
|
Move the Magnification slide to the right to increase the magnification level or to the left to decrease the magnification level |
| Display intensity values | When you slide the Magnification slider right past a certain point, this check box becomes active. |
| Size | Type either a higher number for a larger region or a lower number for a smaller region in the Width box. Valid values range from 64.0 to 198.0. Note: The larger size magnifying glass such as shown in B and C allows to inspect a larger region of the image. |
| Apply | Applies the changes. |
| Close | Closes the dialog box. |
Tip: To review or compare a magnified region of the image with the same region at its original magnification, press Shift. To return to the Magnified view, release the key.
To change the magnification level
1 Right-click on the image while displaying a magnified region. The Magnification dialog box opens.
2 Complete the dialog box, and then press Apply.
3 The magnification level shown in the magnified region changes to the level you specified.
Showing intensity values through the magnification glass
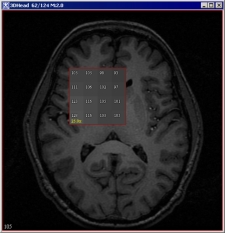
The Display intensity values check box on the Magnification dialog box allows you to display the intensity values within a magnified region of the image.
To show the intensity values:
- Right-click on the image while displaying a magnified region. The Magnification dialog box appears.
- Select the Display intensity values check box. If the check box is not available, or dimmed, increase the magnification by sliding the magnification slider to the right until the check box is active.
- Move the mouse over the image. The intensity values appear within the magnified region.
Tip: If you hold down the middle mouse button, MIPAV writes the intensities by position within the image to the Data page of the Output window. You can then save these messages and print them.
Improving contrast, adding color, etc.
This section explains how to improve image contrast, add color to images, and create negative images by applying a quick lookup table (LUT), generating and modifying a histogram, applying pseudo-color LUTs, and creating negative images by inverting their color.
Histogram- is a representation of a frequency distribution by means of rectangles whose widths represent class intervals and whose areas are proportional to the corresponding frequencies.
Lookup table (LUT)- maps the frequency distribution in a histogram to pseudo-color values.
Improving image contrast with the Quick LUT icon
An easy way to improve the contrast in an image is by using the Quick LUT icon, which is located on the image toolbar in the expanded MIPAV window.
![]() To use Quick LUT:
To use Quick LUT:
- Open an image file. The image appears in an image window. If an image was not previously open, the initial MIPAV window expands to include all of the menus.
- Select the image window.
- Click Quick LUT.
- Hold down the left mouse key and draw a rectangle on a portion of the image.
- Release the left mouse key. Based on the amount of dark and light in the portion of the image that you selected, MIPAV changes the contrast in the image. Repeat steps 3 through 5 as often as you wish to further improve image contrast. When you are satisfied with the contrast, save the image.