From MIPAV
|
|
| Line 4: |
Line 4: |
| | | | |
| | {| border="1" cellpadding="5" | | {| border="1" cellpadding="5" |
| − | |+ <div style="font-style: normal; margin-bottom: 3pt; margin-left: 0pt; margin-right: 0pt; margin-top: 9pt; text-align: left; text-decoration: none; text-indent: 0pt; text-transform: none; vertical-align: baseline">'''<font color="#000000"> Figure 166. An image open in MIPAV and in the MIPAV Surface Plotter default view. At each point of the surface, the height indicates the intensity value for that point. <br /></font>'''</div><div style="font-style: normal; font-weight: normal; margin-bottom: 6pt; margin-left: 18pt; margin-right: 6pt; margin-top: 6pt; text-align: left; text-decoration: none; text-indent: -6pt; text-transform: none; vertical-align: baseline"><font color="#000000"> The Z slider can be used as a cut off for pixel intensities. The read-only box on the right indicates the actual height of the cutoff.<br /></font></div><div style="font-style: normal; font-weight: normal; margin-bottom: 6pt; margin-left: 18pt; margin-right: 6pt; margin-top: 6pt; text-align: left; text-decoration: none; text-indent: -6pt; text-transform: none; vertical-align: baseline"><font color="#000000"> The image slice slider allows to select the image slice. <br /></font></div> | + | |+ <div style="font-style: normal; margin-bottom: 3pt; margin-left: 0pt; margin-right: 0pt; margin-top: 9pt; text-align: left; text-decoration: none; text-indent: 0pt; text-transform: none; vertical-align: baseline">'''<font color="#000000"> Figure 1. An image open in MIPAV and in the MIPAV Surface Plotter default view. At each point of the surface, the height indicates the intensity value for that point. <br /></font>'''</div><div style="font-style: normal; font-weight: normal; margin-bottom: 6pt; margin-left: 18pt; margin-right: 6pt; margin-top: 6pt; text-align: left; text-decoration: none; text-indent: -6pt; text-transform: none; vertical-align: baseline"><font color="#000000"> The Z slider can be used as a cut off for pixel intensities. The read-only box on the right indicates the actual height of the cutoff.<br /></font></div><div style="font-style: normal; font-weight: normal; margin-bottom: 6pt; margin-left: 18pt; margin-right: 6pt; margin-top: 6pt; text-align: left; text-decoration: none; text-indent: -6pt; text-transform: none; vertical-align: baseline"><font color="#000000"> The image slice slider allows to select the image slice. <br /></font></div> |
| | |- | | |- |
| − | |
| |
| − | <div style="font-style: normal; font-weight: normal; margin-bottom: 0pt; margin-left: 0pt; margin-right: 0pt; margin-top: 1pt; text-align: left; text-decoration: none; text-indent: 0pt; text-transform: none; vertical-align: baseline"><font color="#000000"> <br clear="all" />{| align="center"
| |
| | | | | | |
| | [[Image:SurfacePlotterDefault.jpg]] | | [[Image:SurfacePlotterDefault.jpg]] |
| − | |}<br clear="all" /><br /></font></div>
| |
| | |} | | |} |
| | | | |
Revision as of 18:48, 13 February 2012
Displaying images using the surface plotter view
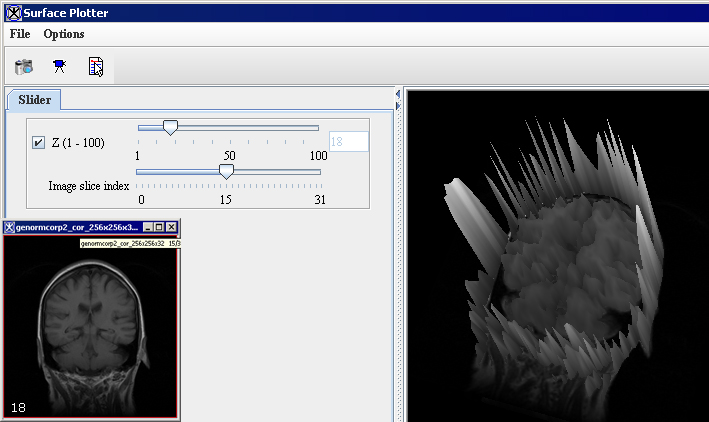
The surface plotter view visualizes the intensity levels for a chosen image using the height of the image surface. The surface plotter takes a 2D image and renders it into a 3D object that is similar to a raised-relief map. Higher intensities are peaks and lower intensities are valleys. The colors that the surface plotter used are the same as those used in the LUT, and when the LUT for the image is updated, so is the LUT for the plotted surface. The image itself is also a part of the scene, and it can be slid along, so that the peaks of the intensity levels match the image.
Figure 1. An image open in MIPAV and in the MIPAV Surface Plotter default view. At each point of the surface, the height indicates the intensity value for that point.
The Z slider can be used as a cut off for pixel intensities. The read-only box on the right indicates the actual height of the cutoff.
The image slice slider allows to select the image slice.
|
|
Surface Plotter window
Figure 167. Surface Plotter windowÂ
|
Menu
|
Â
|
Â
|
|
File
|
Exit-closes the Surface Plotter window.
|
|
Options
|
View Mode- opens the View tab, see [MIPAV_VisualizationTools.html#2373037 "View tab" ] Mouse Recorder- opens the Mouse tab, see [MIPAV_VisualizationTools.html#2373049 "Mouse tab" ] Line Mode-displays the surface plotter image as lines. Resample- improves the speed of animating of the image by resampling and forming the image with fewer triangles. Display Options-allows you to add a bounding box, change colors of the bounding box and background, show an orientation cube, and choose the projection type: perspective or orthographic. See also [MIPAV_VisualizationTools.html#2374137 "Box tab" ]below.
|
|
Help
|
Displays help for this dialog box.
|
Â
|
|
Toolbar
|
 - opens the Camera tab, see [MIPAV_VisualizationTools.html#2374083 "Camera tab" ]  - opens the Mouse tab, see [MIPAV_VisualizationTools.html#2373049 "Mouse tab" ]  - opens the Box tab, see [MIPAV_VisualizationTools.html#2374137 "Box tab" ] |
|
Image area
|
Displays the plotted image.
|
|
Slider tab
|
|
{| align="center"
|
|
|-
|
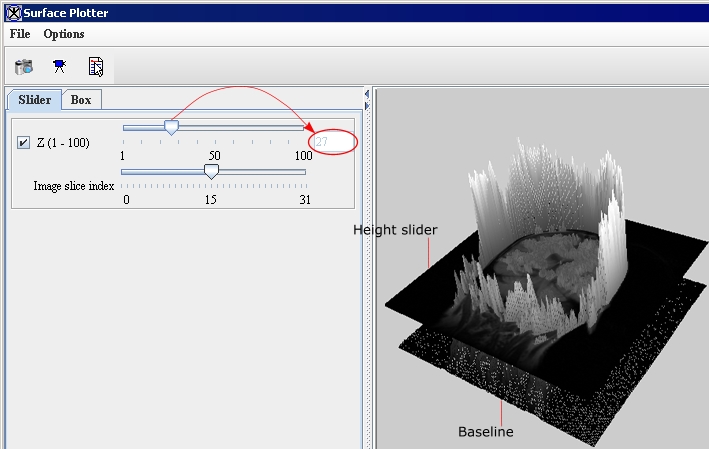
Z(1-100)
| rowspan="1" colspan="2" |
Turns on the ability to visualize the pixel intensities. When this box is selected, the height slider is available. It shows the height of the intensities in the image. Move the slider to the left to show the wider range of intensities: from the lower level to the higher level. Move the slider to the right to set up the cutoff and show only the higher level intensities. The read-only box on the right indicates the actual height of the cutoff.
|-
|
Image Slice slider
| rowspan="1" colspan="2" |
Allows to select a particular slice and visualize the pixel intensities for that slice.
|-
| rowspan="1" colspan="3" |
View tab
|-
| rowspan="1" colspan="3" |
{| align="center"
|
|}
|-
|
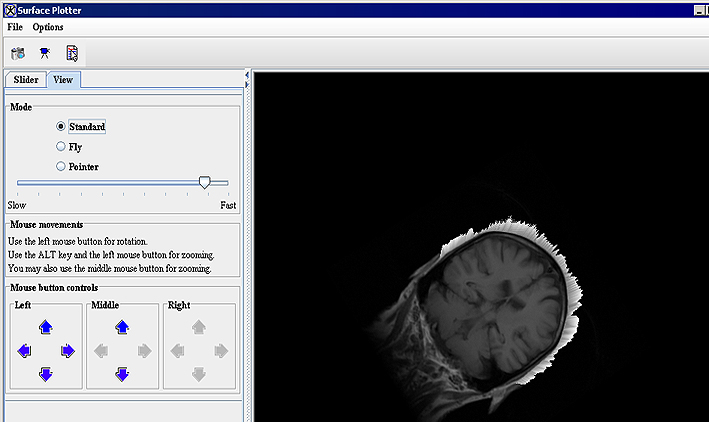
Mode
| rowspan="1" colspan="2" |
Different view modes offer different opportunities for using the mouse controls.
In Standard mode, you can use left mouse button controls for rotation and the ALT left mouse button controls combination of keys for zooming, you can also use middle mouse button controls for zooming.
In Fly mode, left, middle and right mouse button controls are available for zooming, rotation, and also pitch and roll rotation of the image.
In Pointer mode, you can use the mouse pointer for rotation, translation and zooming.
See also [MIPAV_VisualizationTools.html#2374918 "Viewing an image dataset in animate view" on page 248]
|-
|
Slow-fast slider
| rowspan="1" colspan="2" |
use this slider to adjust the speed of the mouse actions.
|-
| rowspan="1" colspan="3" |
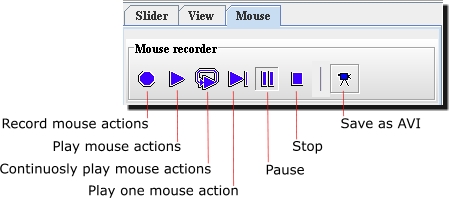
Mouse tab
|-
| rowspan="1" colspan="3" |
See also: [MIPAV_VisualizationTools.html#2375900 "Recording and playing mouse actions" on page 251], [MIPAV_VisualizationTools.html#2375784 "Saving as AVI" on page 255].
|-
| rowspan="1" colspan="3" |
{| align="center"
|
|}
|-
| rowspan="2" colspan="1" |
Mouse recorder controls
| rowspan="2" colspan="2" |
{| align="center"
|
|}
|-
|-
|
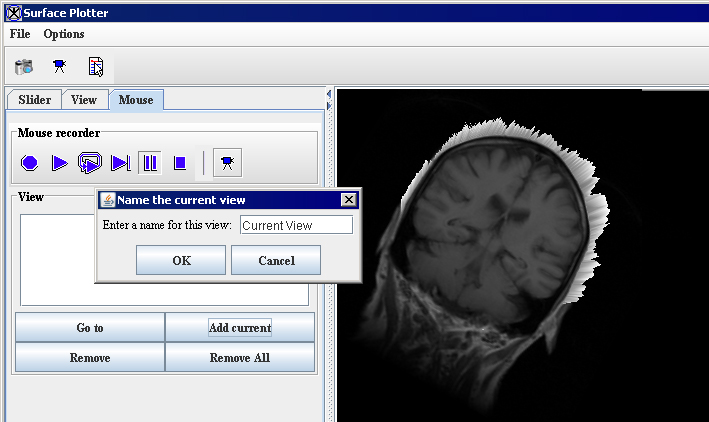
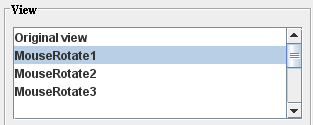
View
| rowspan="1" colspan="2" |
This box displays a list of recorded mouse actions. You can select any of mouse actions from the list as a starting point and start playing the movie from that point.
{| align="center"
|
|}
|-
|
Go to
| rowspan="1" colspan="2" |
- directs the viewer to the selected view.
|-
|
Add current
| rowspan="1" colspan="2" |
- adds a current view to the sequence of views shown in the View box.
|-
|
Remove
| rowspan="1" colspan="2" |
- removes selected view.
|-
|
Remove All
| rowspan="1" colspan="2" |
- removes all views.
|-
| rowspan="1" colspan="3" |
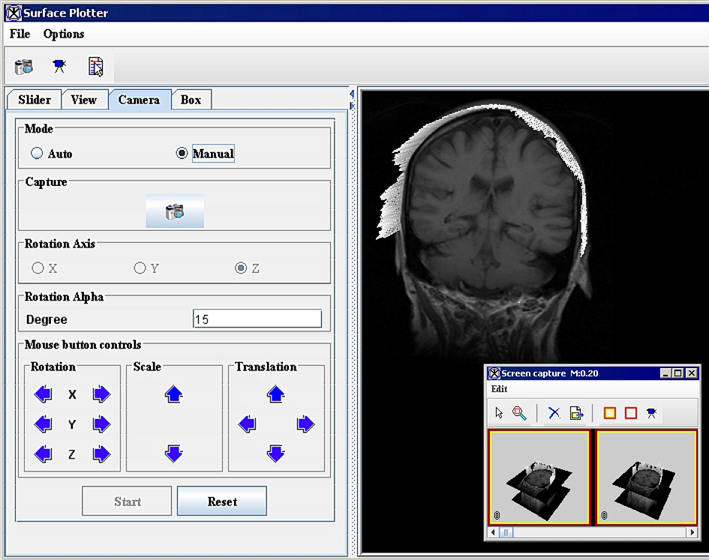
Camera tab
|-
| rowspan="1" colspan="3" |
See also: [MIPAV_VisualizationTools.html#2386836 "Capturing snapshots" on page 253], [MIPAV_VisualizationTools.html#2375784 "Saving as AVI" on page 255].
|-
| rowspan="1" colspan="3" |
{| align="center"
|
|}
|-
|
Mode
| rowspan="1" colspan="2" |
Auto mode allows the automatic rotation and capturing of the image.
Manual mode allows the manual rotation and capturing of the image.
|-
|
Capture
| rowspan="1" colspan="2" |
Press the Camera button to capture the current image view. This option is only available if Manual mode is activated.
|-
|
Rotation Axis
| rowspan="1" colspan="2" |
Use the X, Y, or Z radio buttons to select the rotation axis. This option is only available if Auto mode is activated.
|-
|
Rotation Alpha Degree
| rowspan="1" colspan="2" |
Enter a value for the rotation angle. By default, it is set to 15 degrees. This option is available in both Auto and Manual modes.
|-
|
Mouse button controls
| rowspan="1" colspan="2" |
Use the mouse button controls to rotate, scale and translate the surface plotter view. The mouse button controls are only available in Manual mode.
|-
|
Start
| rowspan="1" colspan="2" |
- starts capturing. Only available in Auto mode.
|-
|
Reset
| rowspan="1" colspan="2" |
- resets the Surface Plotter view.
|-
| rowspan="1" colspan="3" |
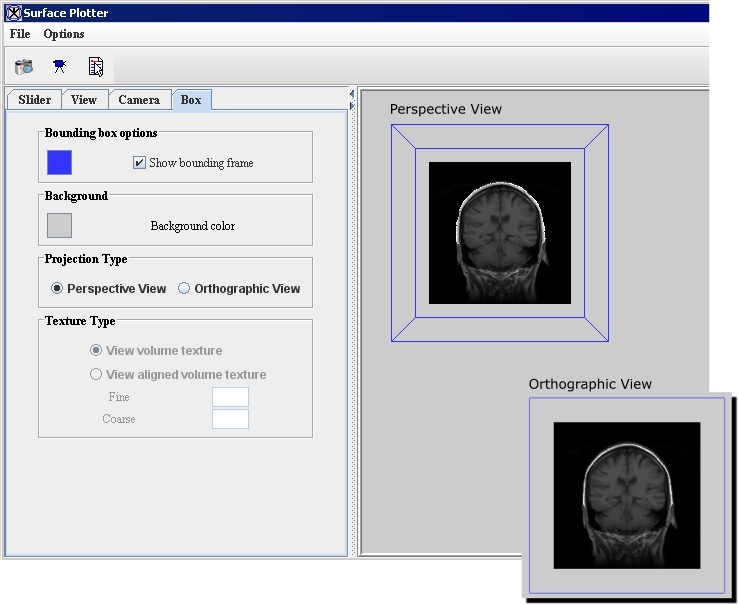
Box tab
|-
| rowspan="1" colspan="3" |
{| align="center"
|
|}
|-
|
Bounding box and Background
| rowspan="1" colspan="2" |
Use these options to change the background and bounding box colors and also to display the bounding box frame.
|-
|
Projection type
| rowspan="1" colspan="2" |
Use the radio buttons to switch between Perspective and Orthographic view.
|-
|
Texture type
| rowspan="1" colspan="2" |
TBD.
|}
Viewing an image dataset in animate view
In animate view, like cine view, the software automatically advances through the image dataset. However, animate view allows you to adjust the speed at which images are advanced using the Slow-Fast slider.
To view an image dataset in Standard mode
1 Select Image > Views > Surface Plotter in the MIPAV window. The Surface Plotter window opens.
2 In the Surface Plotter window, call Options > View Mode to open the View tab.
3 Select Standard mode, and then adjust the mouse action speed slider.
4 Use either the mouse controls, or hold down the left mouse button and drag the mouse to the left, right, top, and bottom. This allows you to move the image in all directions.
5 If you release the left mouse button, and then hold it down again while you move the mouse, you can turn the image upside down.
6 Hold down the middle mouse button (or use the mouse controls) and push the mouse forward. This makes the image smaller as if it has been seen from a distance.
7 Hold down the middle button and push the mouse toward you. This enlarges the image so that you can examine it closely.
You can also use the controls for the middle mouse button.
8 Return to the Slider tab and slide the height slider to determine the highest intensity in the image.
Example: One way of determining the highest intensity in the image is to use the mouse to drag the image to its side, enlarge it using the middle mouse button and pushing the mouse toward you, and then sliding the height marker to the top of the tallest intensity peak. The level of the intensity appears in the box to the right of the height slider.
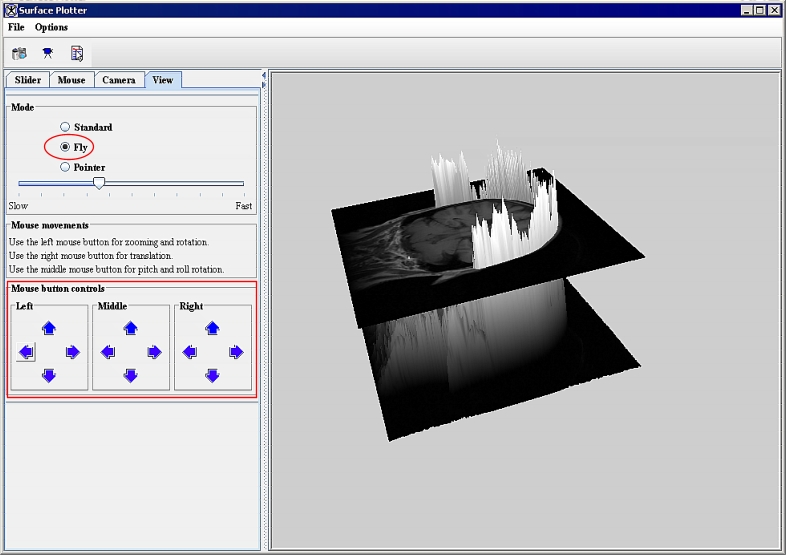
To view an image dataset in Fly mode
1 Select Image > Views > Surface Plotter in the MIPAV window. The Surface Plotter window opens.
2 In the Surface Plotter window, call Options > View Mode to open the View tab.
3 Select Fly mode, and then adjust the mouse action speed slider. See [MIPAV_VisualizationTools.html#2375799 Figure 168].
4 Use the left mouse button controls (upper and lower) to drag the image up and down.
5 Use the left mouse button controls (right and left) to rotate the image along the x axis.
6 Use the middle mouse button controls (upper and lower) to rotate the image along the y axis.
7 Use the middle mouse button controls (right and left) to rotate the image along the z axis.
8 Use the right mouse button controls (right and left) to zoom in or zoom out the image.
9 Use the right mouse button controls (upper and lower) to translate the image.
You can also use the mouse buttons instead of the mouse button controls.
Figure 168. Surface Plotter window - Fly mode
|
{| align="center"
|
|
|-
|
Manipulating of the plotted image in the Surface Plotter window in Fly mode
|}
Surface plotter allows you to record mouse actions (e.g., rotations, translations, and zooming) you performed on the image and create a movie from them. This is available via the Mouse tab. When you record mouse actions, the software makes a copy of the image dataset and loads it in the animate image window. Before starting recording, you can adjust the speed at which images are advanced (the View tab). After recording is completed, you can specify that images be displayed in forward or reverse order, and you can also pause or loop the sequence.


