Reviewing VOI statistics
Contents
Reviewing statistics on a single VOI and VOI groups
The Statistics Generator command on the VOI menu in the MIPAV window opens the Calculate Statistics on VOI Groups window, which allows you to obtain statistics on a single VOI or on multiple grouped VOIs. You can save the statistics to a tab-delimited file, which can then be incorporated into a database. For more information, refer to Calculating statistics on VOI groups page.
Viewing VOI statistics
The Logging page of the Calculate Statistics on VOI Groups dialog box displays the VOI statistics in the tabular form. Whether or not you chose a type of statistic on the Statistics Options page, the table includes a heading for each type. Blanks cells in the table indicate that you did not choose to obtain that particular type of statistics.
Each time you calculate the statistics for a VOI the Statistics Generator adds another row of statistics to the table. Note that the first column in the table lists the name of the VOI and, if appropriate, the slice and contour numbers. Also, you can change the width of each of the columns in the table by dragging the line between the columns in the heading.
You can include and review the statistics file in a database or in a spreadsheet program by double-clicking on the file name in Windows Explorer window and, in the Open with dialog box, selecting the application in which you want to open the file.
When the number of rows in the table exceeds the length of the Logging page, scroll bars appear on the right side of the table to allow you to scroll from the beginning or to the end of the table.
If at any time you want to clear, or erase, all of the rows of the table, select Options > Clear log window. The complete table disappears from the Logging page, which is now totally gray.
Overwriting statistics files
If you previously ran the Statistics Generator and obtained statistics, after you click Calculate a message appears stating that a statistics file already exists. It asks whether to overwrite the file or to cancel the action. If you not want to overwrite the file, click Cancel. The following warning message appears.
Return to the VOI selection page and choose another file name in the VOI statistic file destination box. Then click Calculate to obtain the new set of statistics. The Statistics Generator calculates the statistics and saves them in the file that you indicated. The statistics appear on the Logging page.
If it's all right to overwrite the file,click Overwrite. The Statistics Generator calculates the statistics and overwrites the previously recorded statistics file.
Tip: If you always want the Statistics Generator to overwrite the file, either select Options > Overwrite file automatically or press Alt O.
Generating graphs (intensity profiles)
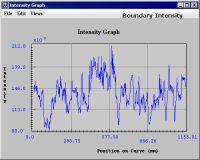
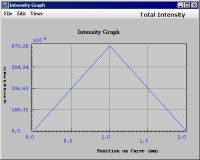
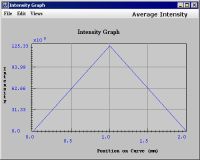
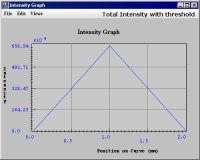
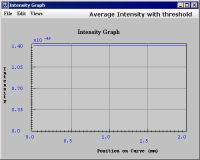
MIPAV can generate a graph of the intensity values of a region bound by a VOI. You can then save this graph or intensity profile, to a file for future reference.
Generating new graphs
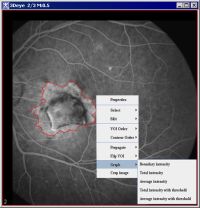
You can generate an intensity profile for any VOI. To generate a graph of a VOI:
- Select a VOI in an image window.
- Use the right mouse button to call the context menu, then select one of the following:
- Graph > Boundary Intensity
- Graph > Total Intensity
- Graph > Average Intensity
- Graph > Total Intensity with Threshold
- Graph > Average Intensity with Threshold
Saving and printing graphs
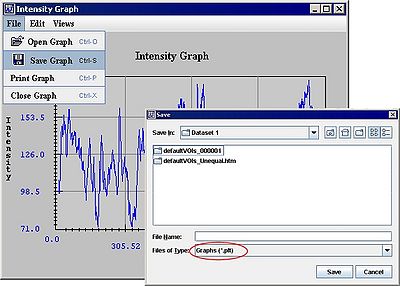
To save a graph to a file:
- Select File > Save graph in the Intensity Graph window or press Ctrl S. The Save dialog box appears.
- Type a name for the graph in File name.
- Make sure that Graphs (.plt) appears in Files of type.
- Click Save. MIPAV saves the file under a specified name.
To print graphs:
- Select File > Print graph in the Intensity Graph window. The Print dialog box appears.
- In the dialog box, select the printer and adjust the print options if necessary.
- Click OK to print the graph or image on your default printer.


