Matrix, Plot, LUT, VOI and Surface files
Contents
Matrix file
What is it and what is its purpose?
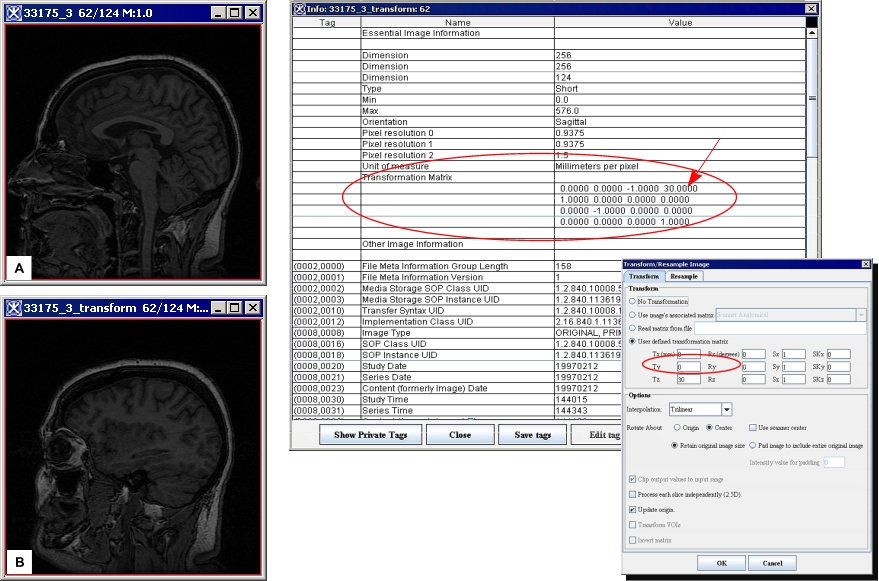
The matrix file provides identity information for an image. It describes the image's orientation, translations, offset scales, rotations, and shears. When any of this information changes in the image, the identity matrix changes.
When and how is it created?
Every image has an identity matrix. The matrix changes when you apply those algorithms or utilities to the image that change any of its identity information.
What does it look like?
If the image is currently open and active, you can view its matrix information by selecting Image > Attributes > View Header in the MIPAV window. The Information dialog box opens see below.
Where is it stored?
MIPAV stores matrix files in the same directory as its associated image.
Plot file
What is it and what is its purpose?
The MIPAV plot (PLT) file contains plot data for an intensity profile, or graph, generated for an image.
When and how is it created?
MIPAV generates the plot file when you delineate a VOI on an image and then do the following:
1 Select one of the following in the MIPAV window:</font></div>
What does it look like?
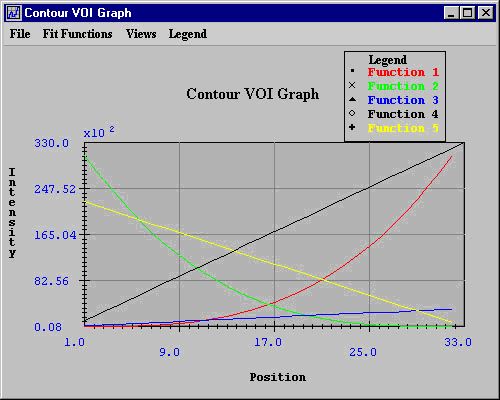
An example of a plot file appears in Figure 8, and Figure 9 shows a graph for this plot file.
The graph has five functions. Each function has 32 points. This file is read vertically. The first two columns show the x and y values for the first function. The next two columns show the x and y values for the second function, and so on. The first point of the first function is (1, 8), the second is (2, 9), and the third is (3, 18).
The first point for the fifth function is (1, 22400), the second is (2, 21700), the third is (3, 21000), and so on. The graph for this plot file appears in Figure 9.
|
1 8 1 30729 1 100 1 1000 1 224002 9 2 27878 2 200 2 2000 2 217003 18 3 25209 3 300 3 3000 3 210004 41 4 22716 4 400 4 4000 4 20300 5 84 5 20393 5 500 5 5000 5 19600 6 153 6 18234 6 600 6 6000 6 18900 7 254 7 16233 7 700 7 7000 7 18200 8 393 8 14384 8 800 8 8000 8 17500 9 576 9 12681 9 900 9 9000 9 16800 10 809 10 11118 10 1000 10 10000 10 16100 11 1098 11 9689 11 1100 11 11000 11 15400 12 1449 12 8388 12 1200 12 12000 12 14700 13 1868 13 7209 13 1300 13 13000 13 14000 Â [This part of the LUT file was removed to save space.] Â 27 18234 27 153 27 2600 27 27000 27 4200 28 20393 28 84 28 2700 28 28000 28 3500 29 22716 29 41 29 2800 29 29000 29 2800 30 25209 30 18 30 2900 30 30000 30 2100 31 27878 31 8 31 3000 32 32000 31 1400 32 30729 32 9 32 3100 33 33000 32 700
|
Where is it stored?
By default, the PLT file is stored in the same directory that holds the image. However, you can store it in any directory of your choice.
VOI file
|
MIPAV VOI FILE 0 # curveType of the VOI 255 # color of VOI - red component 0 # color of VOI - green component 0 # color of VOI - blue component 255 # color of VOI - alpha component 1 # number of slices for the VOI 8 # slice number 1 # number of contours in slice 38 # number of pts in contour 167.0 124.0 161.0 147.0 156.0 156.0 150.0 162.0 144.0 166.0 139.0 170.0 133.0 172.0 128.0 174.0 122.0 175.0 116.0 176.0 111.0 176.0 105.0 175.0 139.0 78.0 144.0 82.0 150.0 86.0 156.0 92.0 161.0 101.0 24862902 # unique ID of the VOI
|
When and how is it created?
MIPAV creates a VOI file when you create one or more VOIs on an image and then select one of the following commands in the MIPAV window:
Because MIPAV VOI file format is a simple ASCII format, it can be easily adapted to other formats. The contours are given as simple closed polygons. One cross-section may contain several polygons. A contour can reside inside another contour. They are oriented so the inside of a contour (material) is on the right side. The xy coordinates range from 0 to 512.
VOI XML file
You can save VOIs as VOI files or VOI XML files. To do so, you delineate one or more VOIs on an image and then select VOI > Save VOI as or VOI > Save All VOIs to. In the Save dialog box, you simply type the file name with a .xml extension and click Save.
What does it look like?
An example of a VOI XML file appears in Figure 11. The middle part of the file was removed to save space.
|
<?xml version="1.0" encoding="UTF-8" ?> - <!-- MIPAV VOI file --> <Unique-ID>24862902</Unique-ID> <Curve-type>0</Curve-type> <Color>255,255,0,0</Color> - <Contour> <Slice-number>8</Slice-number> <Pt>167.0,124.0</Pt> <Pt>161.0,147.0</Pt> <Pt>144.0,166.0</Pt> <Pt>139.0,170.0</Pt> <Pt>133.0,172.0</Pt> <Pt>128.0,174.0</Pt> Â
[This part of the LUT file was removed to save space.] Â <Pt>144.0,82.0</Pt> <Pt>150.0,86.0</Pt> <Pt>156.0,92.0</Pt> <Pt>161.0,101.0</Pt> </Contour> - <Contour> <Slice-number>8</Slice-number> <Pt>159.0,55.0</Pt> <Pt>190.0,55.0</Pt> <Pt>190.0,85.0</Pt> <Pt>159.0,85.0</Pt> </Contour> </VOI>
|

