Histogram Matching
The Histogram Matching (also called Histogram Specification) algorithm generates an output image based upon a specified histogram.
Background
The process of Histogram Matching takes in an input image and produces an output image that is based upon a specified histogram. The required parameters for this algorithm are the input image and the specified image, from which the specified histogram can be obtained.
The algorithm works as follows:
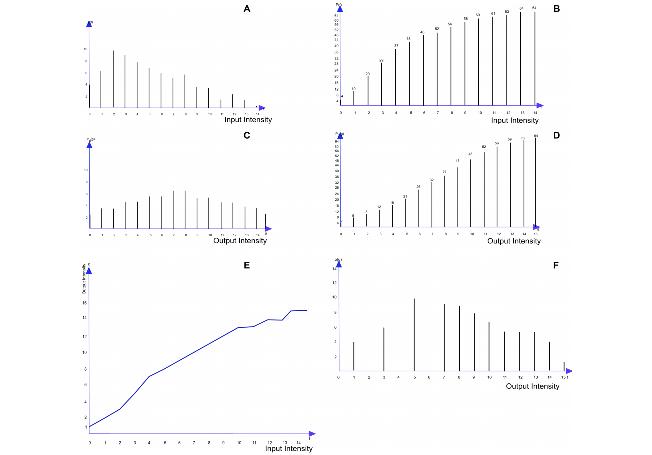
The histograms for the input image p(f) and the specified image pd(g) are generated. Here, the desired histogram of the specified image is denoted as pd(g). Cumulative histograms - P(f) and Pd(g) are then generated using the following equations:
Equation 1
<math>
P(f) = \sum_{k=0}^fp(k)
</math>
Equation 2
<math>
P_d(g) = \sum_{k=0}^gP_d(k)
</math>
where f and g are the pixel intensity levels.
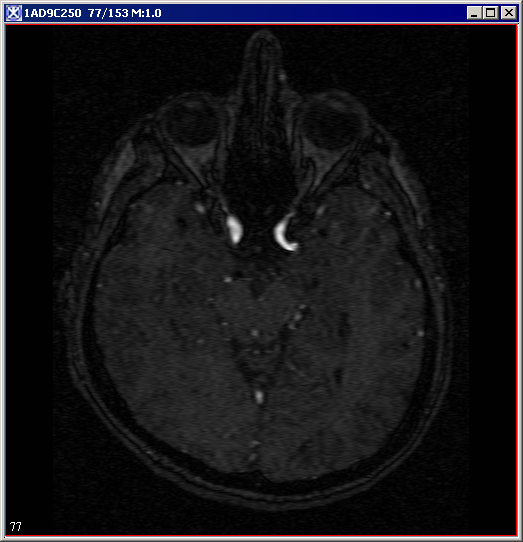
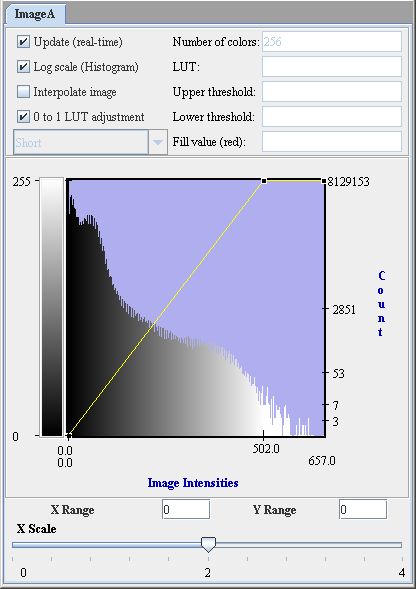
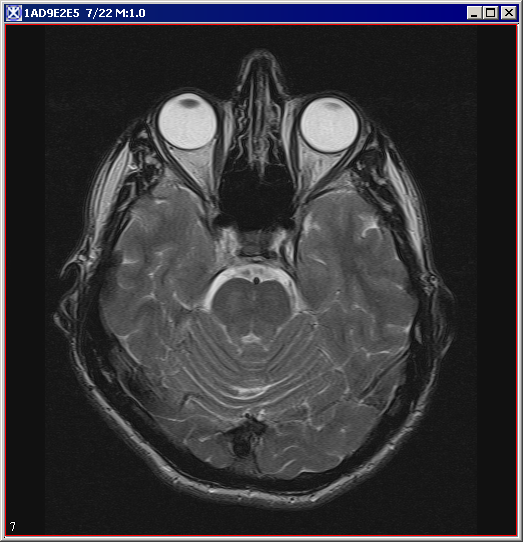
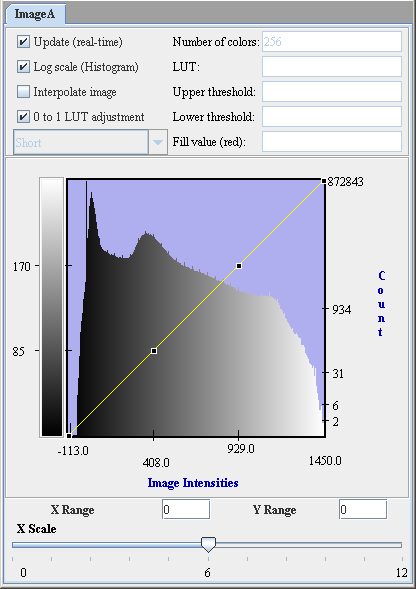
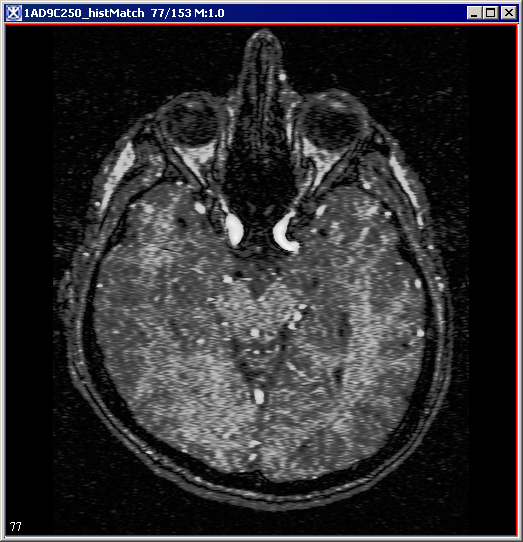
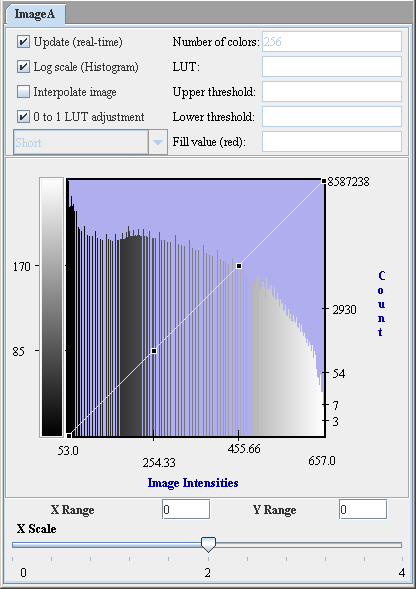
The transformation function is obtained by choosing g for each f, such that if g > f, then Pd(g) > P(f). The transformation function is then applied to the input image to produce an output image by remapping the pixel intensities. The objective is to find a transformed digital picture of a given picture, such that the sum of absolute errors between the intensity level histogram of the transformed picture and that of a reference picture is minimized. Refer to Figure 1.
References
Rafael C. Gonzalez and Richard E. Woods. Digital Image Processing. Addison-Wesley Publishing Company, 1992, pp. 173-182
Jae S. Lim. Two-Dimensional Signal and Image Processing. Prentice-Hall, Inc., 1990, pp. 453-459
Image types
You can apply this algorithm to both color and black-and-white images, as well as 2D and 3D images.
Applying the Histogram Matching algorithm
To use this algorithm, do the following:
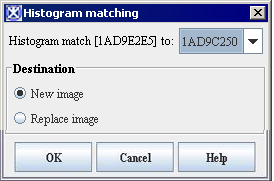
- Select Algorithms > Histogram Tools > Histogram Matching in the main MIPAV window. The Histogram Matching dialog box (Figure 5) appears.
- Complete the information in the dialog box.
- Click OK. The algorithm begins to run, and a progress bar appears momentarily with the status. When the algorithm finishes running, the progress bar disappears, and the results appear in a separate image window.
|
Histogram match <File name> to
|
Select the specified image pd(g) from the list box
|
|
|
New image
|
Shows the results of the algorithm in a new image window
| |
|
Replace image
|
Shows the results of the algorithm in the same image window
| |
|
OK
|
Applies the algorithm according to the specifications in this dialog box.
| |
|
Cancel
|
Disregards any changes that you made in the dialog box and closes this dialog box.
| |
|
Help
|
Displays online help for this dialog box.
| |
