From MIPAV
Generating graphs
MIPAV allows you to generate intensity profiles, or contour VOI graphs, for VOI contours. For delineated VOIs, you can generate 2D, 3D, or 4D intensity graphs. You can also generate a 3D intensity graph at a specific point across all slices in a dataset. For information on how to contour a VOI, refer to [MIPAV_Segmentation.html#1623587 Chapter 1], [MIPAV_Segmentation.html#1433052 "Segmenting Images Using Contours and Masks," ]
Generating contour VOI graphs
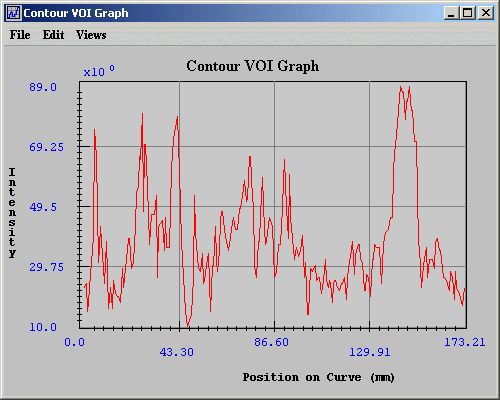
Contour VOI graphs display the intensity values of the selected contour's boundary in the Contour VOI Graph window ([MIPAV_Analysis.html#1039942 Figure 204]). You can generate either 2D or 3D contour VOI graphs.
To generate 2D contour VOI graphs
1 Open an image.
2 Delineate a 2D VOI on the image using one of the 2D icons in the MIPAV window.
Figure 204. Contour VOI Graph windowÂ
|
{| align="center"
|
|
|-
| rowspan="4" colspan="1" |
File
| rowspan="1" colspan="2" |
Open Graph-Opens a PLT file that contains graph data. When you select this command or press Ctrl O on the keyboard, the Open Graph Data dialog box appears.
|-
| rowspan="1" colspan="2" |
Save Graph-Saves the graph data in a PLT file. When you select this command or when you press Ctrl S on the keyboard, the Save dialog box opens.
|-
| rowspan="1" colspan="2" |
Print Graph-Allows you to print the graph. When you select this command or press
Ctrl P, the Print dialog box opens.
|-
| rowspan="1" colspan="2" |
Close Graph-Closes the Intensity Graph window. To close the window, you can also press Ctrl X on the keyboard.
|-
| rowspan="3" colspan="1" |
Edit
| rowspan="1" colspan="2" |
Delete Function-Allows you to delete a specific function. However, you cannot delete a function if it is the only function displayed in the window.
|-
| rowspan="1" colspan="2" |
Copy Function-Copies a function that is currently displayed in the window.
|-
| rowspan="1" colspan="2" |
Paste Function-Pastes a previously copied function into the window. The pasted function has a different color than the first function displayed in the window.
|-
| rowspan="3" colspan="1" |
Views
| rowspan="1" colspan="2" |
Modify Graph Features-Allows you to customize the appearance of the graph.
|-
| rowspan="1" colspan="2" |
Reset Range to Default-[TBD]
|-
| rowspan="1" colspan="2" |
Reset Graph to Original-[TBD].
|-
|
Help
| rowspan="1" colspan="2" |
Help Topics-Displays online help topics.
|}
3 Select the VOI.
As an option, copy the VOI to other slices in the dataset by selecting VOI > Propagate and one of the following commands:
To Next Slice
To Previous Slice
To All Slices
4 Do one of the following:
Select VOI > Graph > Boundary Intensity in the MIPAV window.
Right click on the VOI and then select Graph > Boundary Intensity.
The Contour VOI Graph window ([MIPAV_Analysis.html#1039942 Figure 204]) opens.
To generate 3D contour VOI graphs
1 Open an image.
2 Delineate a VOI on the image using the 3D rectangular VOI icon, in the MIPAV window.
3 Select the VOI.
As an option, copy the VOI to other slices in the dataset by selecting VOI > Propagate and one of the following commands:
To Next Slice
To Previous Slice
To All Slices
4 Do one of the following:
Select VOI > Graph > Boundary Intensity in the MIPAV window.
Right-click on the VOI and then select Graph > Boundary Intensity.
The Contour VOI Graph window ([MIPAV_Analysis.html#1039942 Figure 204]) opens. This window displays a graph of the intensity values of the selected contour's boundary.
Generating intensity graphs
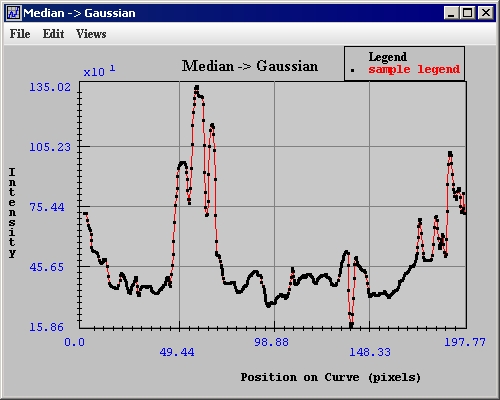
Intensity profiles, or graphs, present information on the intensity values of the VOI region in an image. The intensity graph appears in the Intensity Graph window ([MIPAV_Analysis.html#1038580 Figure 205]).
To generate 2D intensity graphs
1 Open an image.
2 Delineate a 2D VOI on the image using one of the 2D icons in the MIPAV window.
3 Select the VOI.
As an option, copy the VOI to other slices in the dataset by selecting VOI > Propagate and one of the following commands:
To Next Slice
To Previous Slice
To All Slices
4 Do one of the following:
Select VOI > Graph in the MIPAV window and either of the following:
2.5D Total Intensity-To generate a graph of the sum of the intensity values of the VOI region.
2.5D Average Intensity-To generate a graph of the average of the intensity values of the VOI region.
Right-click on the VOI and then select Graph and one of the following commands:
2.5D Total Intensity-To generate a graph of the sum of the intensity values of the area delineated by the VOI per slice.
2.5D Average Intensity-To generate a graph of the average of the intensity values of the VOI region.
2.5D Total Intensity with Threshold-TBD.
2.5D Average Intensity with Threshold-TBD.
The Intensity Graph window ([MIPAV_Analysis.html#1038580 Figure 205]) opens.
Figure 205. Intensity Graph windowÂ
|
File
|
Open Graph-Opens a PLT file that contains graph data. When you select this command or press Ctrl O on the keyboard, the Open Graph Data dialog box appears.
|
{| align="center"
|
|
|-
|
Â
|
Save Graph-Saves the graph data in a PLT file.
When you select this command or when you press Ctrl S on the keyboard, the Save dialog box opens.
|-
|
Â
| rowspan="1" colspan="2" |
Print Graph-Allows you to print the graph. When you select this command or press
Ctrl P, the Print dialog box opens.
|-
|
Â
| rowspan="1" colspan="2" |
Close Graph-Closes the Intensity Graph window. To close the window, you can also press Ctrl X on the keyboard.
|-
|
Edit
| rowspan="1" colspan="2" |
Delete Function-Allows you to delete the function that you select. However, you cannot delete a function if it is the only function displayed in the window.
|-
|
Â
| rowspan="1" colspan="2" |
Paste Function-Pastes a previously copied function into the window. The pasted function has a different color than the first function displayed in the window.
|-
|
Views
| rowspan="1" colspan="2" |
Modify Graph Features-Allows you to customize the appearance of the graph.
|-
|
Â
| rowspan="1" colspan="2" |
Reset Range to Default-TBD.
|-
|
Â
| rowspan="1" colspan="2" |
Reset Graph to Original-TBD.
|-
|
Help
| rowspan="1" colspan="2" |
Help Topics-Displays online help topics.
|}


