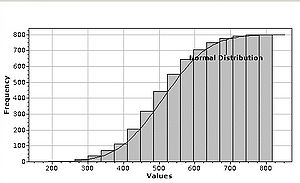
Cumulative Histogram
Cumulative Histogram The cumulative histogram is a histogram in which the vertical axis gives not just the counts for a single bin, but rather gives the counts for that bin plus all bins for smaller values of the response variable.
Contents
Background
Let I:Q -> [0,1] be an image and h is the distribution of its values (a histogram). The cumulative histogram of I is the function H: [0,1] -> [0,1] defined by
<math> H(x)=\int_0 ^x h(t)d(t) </math>
Examples
Following examples display cumulative histograms for grayscale and RGB images. Figure 12 shows a 3D grayscale image (a) and its cumulative histogram (b). Figure 13 and Figure 14 show 2D RGB images and their cumulative histograms for each channel. Note that, the RGB image from Figure 13 has in fact only two color channels - Red and Blue, therefore its cumulative histogram for the Green channel shows nothing.
References
For more information about the Cumulative Histogram algorithm, please refer to the MIPAV HTML Help.


