Creating new images
From MIPAV
To create a new image file
1 Do one of the following:
If an image file is not already open, select File > Open Image(A) > Create Blank Image.
If an image file is already open, select File > Load Image (B)> Create Blank Image. The Raw dialog box ([MIPAV_QuickStart.html#1074295 Figure 29]) appears.
2 In the dialog box, select the image type.
3 Select the units of measure for each dimension.
4 Enter the header offset and byte ordering information.
5 Click OK. A blank image ([MIPAV_QuickStart.html#1074295 Figure 29]) appears in an image window.
6 Use the paint and VOI tools to create an image.
7 Click File > Save image as. The Save dialog box opens.
8 Type the name of the file in File Name, and select the file type in Files of type.
9 Click OK. MIPAV saves the image under the file type you selected.
Figure 29. Raw dialog box
{| align="center" | 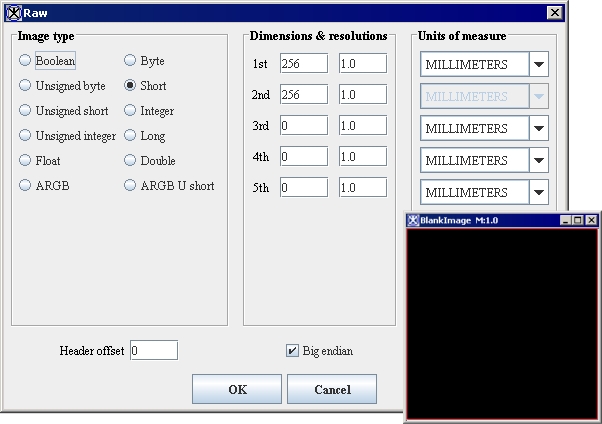 |} |}
|
|
Image type
|
Synonymous with data type. The image type determines the number of intensities that can be represented in an image. For example, a Boolean image can display two intensities: 1 and 0. Boolean-1 bit per pixel (1 on, 0 off)
Unsigned byte-1 byte per pixel (0, 255)
Unsigned short-2 bytes per pixel (0, 65535)
Unsigned integer-4 bytes per pixel (0, 232 -1)
Float-4 bytes per pixel (-3.4E38, 3.4E38)
ARGB-3 bytes per pixel, plus 1 byte; 8 bits per color channel (alpha, red, green, and blue)
Byte-1 byte per pixel (-128, 127)
Short-2 bytes per pixel (-32768, 32767)
Integer-4 bytes per pixel (-231, 231-1)
Long-8 bytes per pixel (-9.22E18, 9.22E18)
Double-8 bytes per pixel (-1.8E308, 1.8E308)
ARGB U short-2 bytes per color channel and 2 bytes for alpha channel
|
|
Dimensions and resolutions
|
Degree of manifolding of a quantity such as space or time. Two-dimensional datasets are composed of one image (the two dimensions are length and width). Generally, three-dimensional datasets are composed of more than one image. The third dimension is generally space. The fourth dimension is generally time. (Either time or space can be the third or fourth dimensions.) Zeros in the text boxes indicate that the dimension is not represented in the image. For example, if the text boxes for the first and second dimensions are filled, and the rest of the text boxes are filled with a zero, the image only has two dimensions. Dimensions 1st-Width (along x axis)
2nd-Length (along y axis)
3rd-Depth (along z axis)
4th-Time (along t axis)
5th-Fifth dimension
Resolutions Size of pixel or voxel per dimensions 1 through 5.
|
|
Units of measure
|
Indicates the unit of measurement for each of the applicable dimensions.
|
|
Header offset
|
Indicates the size of the space reserved at the beginning of the file where specific types of information is kept. This space, which is called the header, precedes the image data. If you know the length of the header, type it in this box. When MIPAV accesses the file, it skips the header offset and begins to read the image data. Note that not all image file formats have a header.
|
|
Big endian
|
Indicates whether image data is stored in the big endian format. If not, the image data is stored in the little endian format. Endianess refers to the byte ordering of the data. Some computers order the data with the least significant byte (LSB) first followed by the most significant byte (MSB). This byte order is referred as little endian or Intel byte ordering. Machines that use little-endian byte ordering are VAXes, Intel x86, and Pentium. The reverse is MSB and then LSB, which is referred as big endian or Motorola byte ordering. Machines that use big-endian byte ordering are IBM System 3D, RISC, and a Motorola 680x0. MIPAV is biendian; it supports both big- and little-endian byte-ordering formats.
|
|
OK
|
Applies the parameters that you specified and creates a blank image.
|
|
Cancel
|
Disregards any changes you made in this dialog box, closes the dialog box, and does not create a blank image.
|
|
Help
|
Displays online help for this dialog box.TBD.
|
Delineating volumes of interest (VOIs)
MIPAV provides tools that allow you to automatically, semiautomatically, and manually identify and modify volumes of interest (VOIs).
volume of interest-the portion of the image in the dataset on which you want to focus. It may be either one slice or multiple slices throughout the dataset.
Each VOI can be formed from multiple contours in a single slice or multiple slices. Once an object is segmented and defined by a VOI, statistics of the volume can be calculated.
MIPAV supports over 32,000 unique VOIs on a single dataset. Additionally, you can move or delete nodes on the VOI and add new points. VOI types include:
Point, which is created by using
2D line
Rectangular
3D rectangular
2D elliptical
Polygonal
3D polygonal
Interactive level-set
Generating contour VOIs using predefined shapes
MIPAV includes icons of predefined shapes, such as points, lines, ellipses, or rectangles, that you can use to create VOIs. These icons are on the VOI toolbar.
To generate contour VOIs using the predefined shapes
1 Select one of the contour icons from the VOI toolbar in the expanded MIPAV window. See also [MIPAV_QuickStart.html#2693625 Figure 12].
2 Move the pointer to the image window. The pointer changes to a cross-hair shape. Do one of the following:
Points, levelset: Position the cursor on the area where the point or levelset should be drawn. Click the mouse button.
Straight lines, rectangles (2D and 3D), ellipsoids: Position the cursor on the area where the contour should begin.
Click the mouse button.
While holding down the mouse button, drag the cursor until the contour is the desired size.
Polylines, polygons: Position the cursor over the area where the contour should begin.
Click the mouse button. A point appears. Alternate between moving the mouse and selecting the mouse button to outline the VOI.
To complete a polyline, double-click the mouse button. To complete a polygon, connect the first and last nodes.
Tip: To draw the same shape several times in succession, hold down the Shift key while you select the applicable icon from the VOI toolbar and draw.
Adding and moving boundary points on VOIs
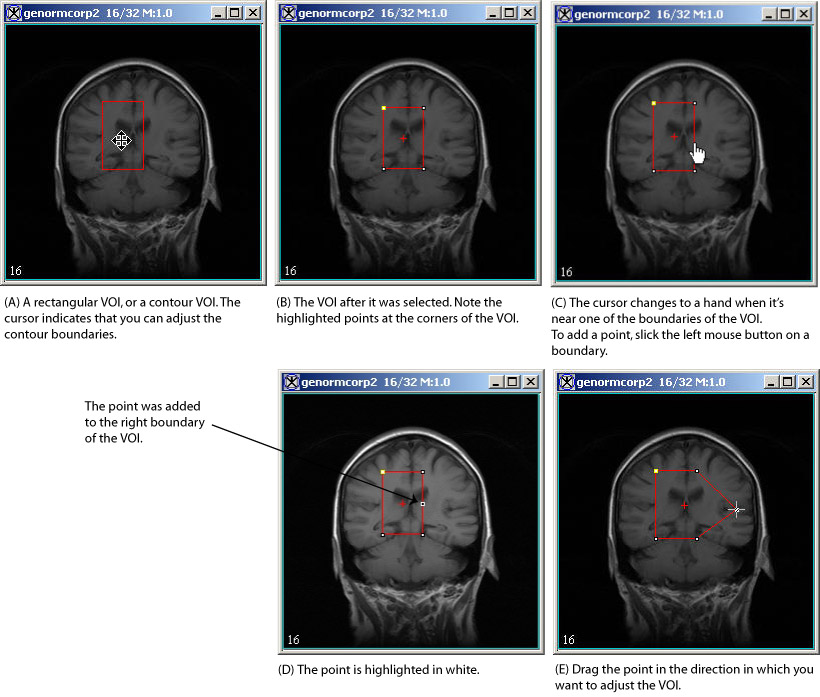
No matter which method chosen to delineate a VOI, you can add points and change the boundaries of the VOI. For example, suppose you created a VOI on an image with the Rectangle VOI icon. If you notice that a part of the image that should be included in the VOI is not included, the boundary of the rectangle needs to be adjusted to include the missing portion of the image.
To add a point and change the boundary of the VOI
1  Select the VOI. Notice that white points appear at the corners of the VOI and a small cross appears in the middle of the VOI.
2  Place the cursor on the portion of the VOI you want to adjust. The cursor changes from a cross to.
3 Click once. A white point appears on the line.
4 Select the point and drag it to include the missing part of the image.
Tip: Circular VOIs are composed of a continuous series of points around the diameter of the circle. You only need to select one of those points and drag it to enlarge the circle.
Figure 30. Adding a point and adjusting the boundary of a rectangular VOI
|
{| align="center"
|
|
|}
Automatically adjusting contour boundaries
After a contour is drawn, it might be necessary to adjust the boundaries so it more closely matches the VOI region.
To adjust contours
1 Click a contour. The nodes become visible.
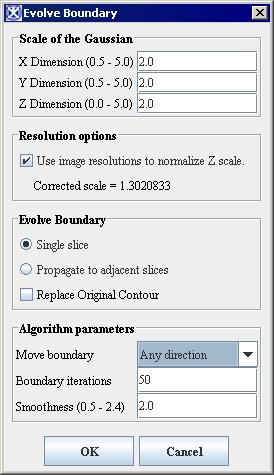
2 Select VOI > Evolve boundary 2D >Active Contour. The Evolve Boundary dialog box opens.
3 Modify the information in the window if necessary.
4 Click OK.
A new contour, that more closely outlines the VOI, appears on the image. The old contour also remains.
 To delete an old contour, select the contour, and then select Cut Selected Contour, or press the Del key on the keyboard.
|
Scale of the Gaussian
|
Enter values for X,Y, and Z directions which will be used to correct blurring. The default value is 2.0
|
{| align="center"
|
|
Â
Â
Â
Â
Â
Â
Â
Â
Â
|-
|
Resolution options
|
If this box is checked, the algorithm uses the image resolution to normalize the Z scale.
|-
|
Evolve Boundary
|
Single slice - the VOI boundary will be evolved only for the current slice;
Propagate to Adjacent Slices - the VOI will be propagated to adjacent slices;
Replace Original Contour - the original VOI will be replaced with the new one.
|-
|
Algorithm parameters
| rowspan="1" colspan="2" |
Move Boundary - depending on the selected option, the VOI will be moved in 1) any direction, 2) only inward, 3) only outward.
Boundary Iterations- specify the number of iterations needed to calculate the new boundary.
Smoothness- enter the number from 0.5 to 2.4 to specify smoothness.
|-
|
OK
| rowspan="1" colspan="2" |
Applies the algorithm according to the specifications in this dialog box.
|-
|
Cancel
| rowspan="1" colspan="2" |
Disregards any changes that you made in this dialog box and closes it.
|-
|
Help
| rowspan="1" colspan="2" |
TBD.
|-
| rowspan="1" colspan="3" |
Figure 31. Evolve Boundary dialog boxÂ
|}
Annotating images with text
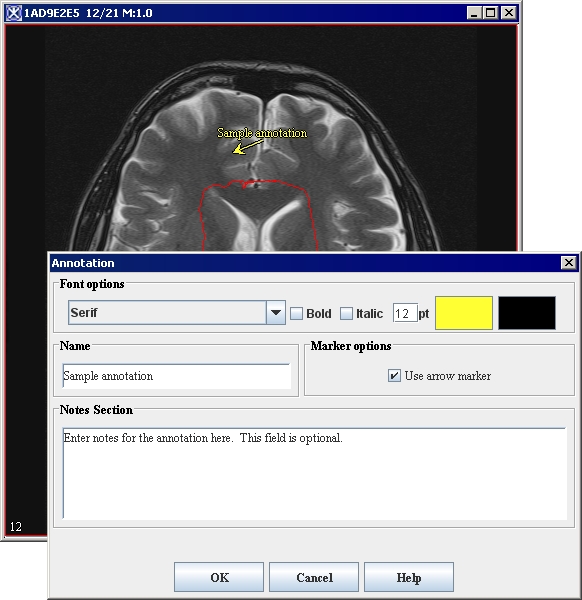
 Another icon on the VOI toolbar is the Annotation tool icon, which you can use to place text directly on an image at any position on the image. You can use any font family, or typeface, that is installed on your computer to display the text.
To annotate images with text
1 Open an image.
2 Click the Annotation tool icon. The Annotation dialog box ([MIPAV_QuickStart.html#2695189 Figure 32 on page 49]) opens.
3 Click the image on which you want the text to appear. The image becomes the active image.
4 Select the font family and style (bold or italic). To select a regular font style, simply specify the font family.
5 Type the font size of type in the pt. box.
6 Press Enter. The Annotation dialog box either enlarges or reduces in size depending on the type size you chose (see [MIPAV_QuickStart.html#2695208 "Previewing Font Selection" on page 50] below).
7 Click Color to select the color of the text. The color of the type in the Text box changes to the color you have chosen.
8 Select "Enter text here" and type the text that you want to display on the image in the Text box.
9 Click OK. The text appears near the top of the image.
10 Click the text and drag it to any position on the image.
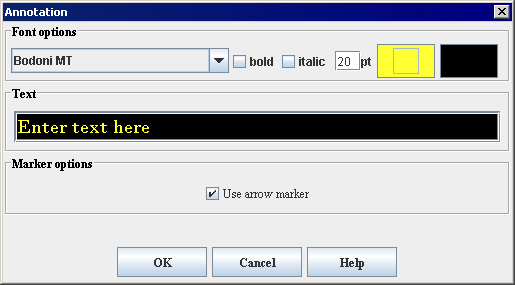
Figure 32. Annotation dialog box
|
Font options
|
Font-Specifies the font family, or typeface, for the text. When you select another typeface, "Enter text here" appears in that typeface.
|
{| align="center"
|
|
|-
|
|
Bold-Specifies that the type style should be bold.
|-
|
|
Italic-Specifies that the type style should be italic.
|-
|
|
Pt. (point) size-Specifies the point size of the typeface.
|-
|
|
Color-Specifies the color of the text. When you click this box, the Pick VOI Color dialog box opens.
|-
|
Text
| rowspan="1" colspan="2" |
Displays the text that should appear on the image.
|-
|
Marker options
| rowspan="1" colspan="2" |
The arrow marker appears if you check the Use Arrow Marker box.
|-
|
OK
| rowspan="1" colspan="2" |
Applies the parameters that you specified and places the text on the image, which you can move to any position on the image.
|-
|
Cancel
| rowspan="1" colspan="2" |
Disregards any changes you made in this dialog box, closes the dialog box, and does not place text on the image.
|-
|
Help
| rowspan="1" colspan="2" |
Displays online help for this dialog box.
|}
|
Previewing Font Selection
The Annotation dialog box allows you to preview the font family, style, size, and color of the text before you click OK and add the text to the image.
{| align="center"
|
|
Â
Â
|}
To edit the text
1 Double-click the added text on an image. The Annotation dialog box opens.
2 Make any changes you want to the text, font family, font style, and color.
3 Click OK. The changes you made to the text should appear on the image.
To delete the text
1 Select the added text on an image.
2 Press Del. MIPAV removes the text from the image.
To restore the text to the image, select Edit > Undo VOI. The text reappears on the image.
Calculating VOI statistics
Once a VOI is drawn, you can calculate the number of voxels in the VOI, the volume, and area. You can also calculate the average and standard deviation of the voxel intensity and the center of mass. For 2D images, you can calculate the principal axis and the eccentricity. MIPAV provides two methods for you to obtain VOI statistics:
By using VOI properties-This method is fast and simple and provides statistics for the entire VOI. Although it allows you to save the results in a text file, that is an additional step. However, using this method, you can type additional information directly onto the Data page with the statistics.
By using the Statistics Generator-Using this method, you can obtain statistics on the entire VOI, on a single slice of the VOI, or by contour and slice. The Statistics Generator also automatically saves the results in either a tab-delimited file or an XML file of your choosing. In addition, it displays statistics in a tabular format.
Note: MIPAV can calculate statistics for only one VOI at a time. In addition, MIPAV calculates the volume and area in a VOI using image pixel (voxel) resolutions.
Using VOI properties
To calculate VOI statistics
1 Select the desired VOI in the image window.
2 Select VOI > Properties in the MIPAV window. The VOI Statistics dialog box appears.
3 Select the statistics to be calculated in Statistics to Calculate. Click Calculate. The VOI Statistics dialog box remains on the desktop. In a few moments, statistical data appears on the Data page in the Output window.
4 To close the dialog box, click Cancel in the VOI Statistics dialog box when complete.
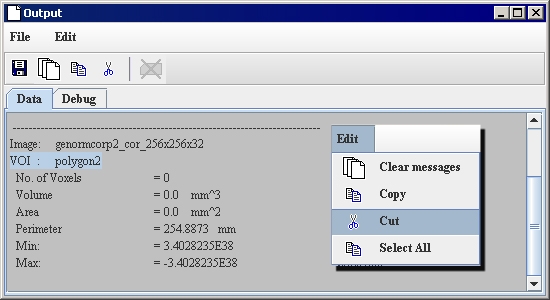
5 To add information to the statistics, just type it in into the statistics on the Data page.
6 To remove the data, select them first, and then click the Cut icon or select Edit > Cut to cut the selected data. MIPAV removes the selected text from the Output window and copies it to the clipboard for use in other applications.
7 Select the data that you want to copy, and then click Copy or select Edit > Copy to copy the data to another location in the window or to another application (such as a word processor).
8 Click Save or select File > Save messages to save the data and any comments you've added to a text file.
9 Click Clear Messages or select Edit > Clear Messages to clear the window.
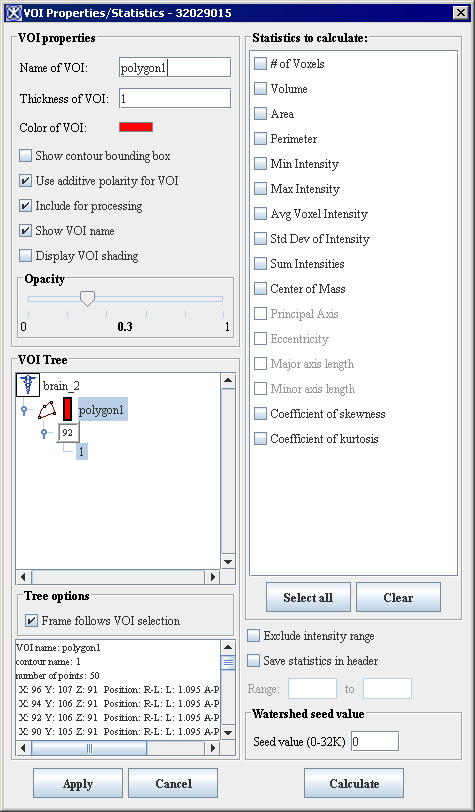
Figure 33. VOI Statistics dialog boxÂ
|
VOI Properties
|
|
Name of VOI
|
Shows the name of VOI.
|
{| align="center"
|
|
|-
|
Thickness of VOI
|
Shows the number which represents how many slices has a selected VOI.
|-
|
Color of VOI
|
Shows the color that was used to outline the VOI.
|-
|
Show contour bounding box
|
Highlights the VOI and, when you select the VOI, displays a box that encompasses all of the VOI's borders and lists the measurements and position of each boundary.
|-
|
Use additive polarity for VOI
|
If selected, put VOI names, such as "polygon1" to indicate VOI location.
|-
|
Include for processing
|
This option is very helpful if you have a set of VOIs delineated on your image and want to use some of them for masking. See [MIPAV_QuickStart.html#2829081 "Using the Include for Processing option" ].
|-
|
Show VOI name
|
If selected, shows the name of the chosen VOI. E.g. "polygon1."
|-
|
Display VOI shading
| rowspan="1" colspan="2" |
Shades the area inside a chosen VOI.
When this option is selected, the Opacity slider becomes also available, so you can regulate the opacity of the shaded area.
|-
| rowspan="1" colspan="3" |
Statistics to calculate
|-
|
Â
|
Provides a list of statistics. Select the statistics that you want to include in the report.
| rowspan="3" colspan="1" |
{| align="center"
|
|}
|-
|
Select all
|
Selects all of the statistics listed in the Statistics to calculate list.
|-
|
Clear
|
Clears all of the check boxes that you selected in the Statistics to calculate list.
|-
|
VOI Tree
| rowspan="1" colspan="2" |
Displays all VOIs delineated on the image in an hierarchical view.
|-
|
Tree options
| rowspan="1" colspan="2" |
Frame follows VOI selection - if this option is selected, the current selected VOI appears in a frame in the VOI tree.
|-
| rowspan="1" colspan="2" |
Exclude intensity range
|
Allows you to select specific intensity ranges that you want to exclude from the calculation.
|-
| rowspan="1" colspan="2" |
Watershed seed value (0-32K)
|
Indicates the basin value used when running the Watershed algorithm on images.
|-
|
Apply
| rowspan="1" colspan="2" |
Applies the changes you made in this dialog box and leaves the dialog box open for you to make further changes.
|-
|
Cancel
| rowspan="1" colspan="2" |
Disregards any changes you made in this dialog box, closes the dialog box, and does not run a statistics report.
|-
|
Calculate
| rowspan="1" colspan="2" |
Calculates the statistics requested in this dialog box and displays them in the Data page of the Output window.
|}
The Include for Processing option is very helpful if you have a set of VOIs delineated on your image and want to use some of them for masking. In that case, select the VOI(s) of interest, then activate the Include for Processing option, and after that, call one of the mask tools, e.g. the Quick AND VOI mask operation. The tool will apply on the selected VOI(s). In case when the Include for Processing option has not been activated, then the Quick AND VOI mask operation will apply on the whole image and darken it. See [MIPAV_QuickStart.html#2829292 Figure 34] (a) and (b).
 |}
|}


