Changing the legends for functions
From MIPAV
Changing the legends for functions
The Legend page controls whether a legend appears on the contour VOI graph or intensity graph and allows you to assign a specific name to each function. By default, the legend does not appear on the graph; however, when you choose so, the legend appears in the upper right corner of the graph.
To display or hide legends
1 Open an image.
2 Delineate a VOI on the image.
3 Generate an intensity profile (refer to [MIPAV_Analysis.html#1082499 "Generating graphs" on page 325]). Either the Contour VOI Graph window ([MIPAV_Analysis.html#1039942 Figure 204 on page 325]) or the Intensity Graph window ([MIPAV_Analysis.html#1038580 Figure 205 on page 329]) opens.
4 Select Views > Modify Graph Features in either the Contour VOI Graph window or the Intensity Graph window. The Modify Graph dialog box ([MIPAV_Analysis.html#1361809 Figure 207 on page 332]) appears.
5 Select the Legend tab. The Legend page ([MIPAV_Analysis.html#1040215 Figure 215]) appears.
6 Do one of the following:
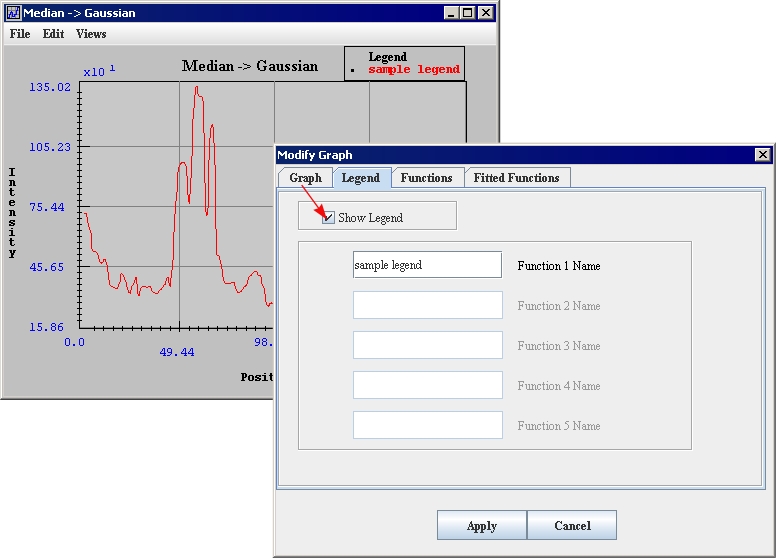
To display the legend on the graph, select Show legend. A check mark appears in the check box.
To hide the legend, clear Show legend. The check mark disappears from the check box.
7 Click Apply.
If you selected Show legend, the legend appears in the upper right of the graph ([MIPAV_Analysis.html#1046267 Figure 216]).
If you cleared Show legend, the legend disappears from the graph.
8 Do one of the following:
Close the Modify Graph dialog box.
Keep the Modify Graph dialog box open to continue modifying the graph.
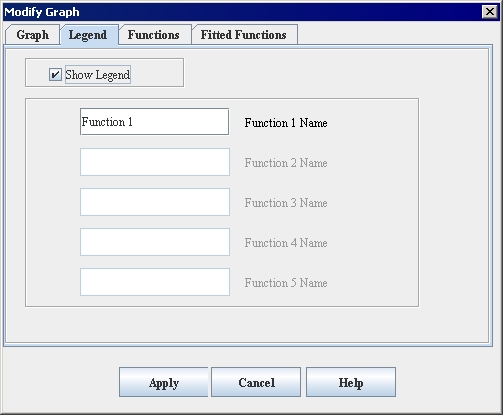
Figure 215. Legend page of the Modify Graph dialog box
|
Legend tab
|
|
Show legend
|
Displays, if selected, the legend on the upper right side on the graph in either the contour VOI graph or the Intensity Graph window.
|
{| align="center"
|
|
|-
|
Function N name
|
Specifies the name of the function. By default, the name is Function 1, but you can replace this name with any name you choose.
This page allows you to specify up to five function names as long as those functions exist.
|-
|
Apply
|
Applies the parameters that you specified.
|-
|
Cancel
| rowspan="1" colspan="2" |
Disregards any changes that you made in this dialog box and closes the dialog box.
|-
|
Help
| rowspan="1" colspan="2" |
Displays online help for this dialog box.
|}
Figure 216. Legend at the upper right of the graph
|
{| align="center"
|
|
|}
Changing the appearance of functions
The Functions page in the Modify Graph dialog box allows you to display or hide the points on functions, display or hide from one to five functions, and change the color of functions.
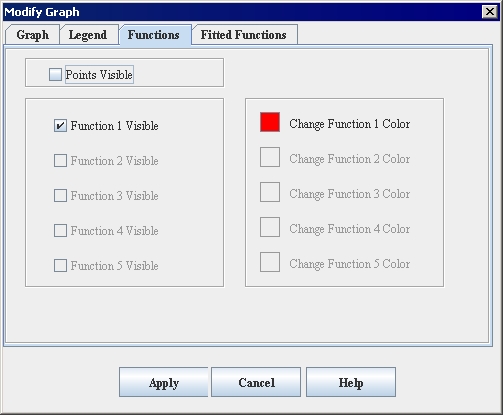
Figure 217. Functions page in the Modify Graph windowÂ
|
Functions tab
|
|
Points visible
|
Displays, if selected, all of the points on the functions.
|
{| align="center"
|
|
|-
|
Function N visible
|
Displays, if selected, function #N on the graph. You can display from one to five functions. This dialog box allows you to select only those functions that exist. Otherwise, they are dimmed.
|-
|
Change function N color
|
Allows you to choose the color to use for displaying function N (listed on the left). When you select this icon, the Pick Background Color dialog box opens.
|-
|
Apply
| rowspan="1" colspan="2" |
Applies the parameters that you specified.
|-
|
Cancel
| rowspan="1" colspan="2" |
Disregards any changes that you made in this dialog box and closes the dialog box.
|-
|
Help
| rowspan="1" colspan="2" |
Displays online help for this dialog box.
|}
To display or hide the points on functions
1 Open an image.
2 Delineate a VOI on the image.
3 Generate an intensity profile (refer to [MIPAV_Analysis.html#1082499 "Generating graphs" on page 325]).
Either the Contour VOI Graph window ([MIPAV_Analysis.html#1039942 Figure 204 on page 325]) or the Intensity Graph window ([MIPAV_Analysis.html#1038580 Figure 205 on page 329]) opens.
4 Select Views > Modify Graph Features in either the Contour VOI Graph window or the Intensity Graph window.
The Modify Graph dialog box ([MIPAV_Analysis.html#1361809 Figure 207 on page 332]) opens.
5 Select the Functions tab. The Functions page ([MIPAV_Analysis.html#1046698 Figure 217]) appears.
To display the points, select Points visible. A check mark appears in the check box.
To make the points invisible, clear Points visible. The check mark disappears from the check box.
6 Click Apply.
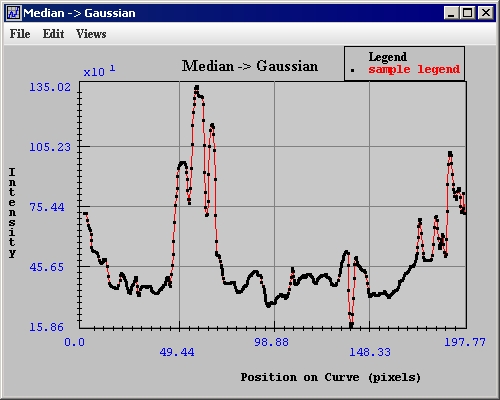
If you selected Points visible, the points appear on the functions ([MIPAV_Analysis.html#1046499 Figure 218]).
If you cleared Points visible, the points disappear from the function.
7 Do one of the following:
Close the Modify Graph dialog box.
Keep the Modify Graph dialog box open to continue modifying the graph.
Figure 218. Points on a function whose color changed from red to blue
|
{| align="center"
|
|
|}
To display or hide functions
1 Open an image.
2 Delineate a VOI on the image.
3 Generate an intensity profile (refer to [MIPAV_Analysis.html#1082499 "Generating graphs" on page 325]).
Either the Contour VOI Graph window ([MIPAV_Analysis.html#1039942 Figure 204 on page 325]) or the Intensity Graph window ([MIPAV_Analysis.html#1038580 Figure 205 on page 329]) opens.
4 Select Views > Modify Graph Features in either the Contour VOI Graph window or the Intensity Graph window.
The Modify Graph dialog box ([MIPAV_Analysis.html#1361809 Figure 207 on page 332]) opens.
5 Select the Functions tab. The Functions page ([MIPAV_Analysis.html#1046698 Figure 217]) appears.
6 Do one of the following:
To display the function, select Function N visible. A check mark appears in the check box.
To remove the function from the graph, clear Function N visible. The check mark disappears from the check box.
7 Click Apply.
If you selected Function N visible, the function appears on the graph.
If you cleared Function N visible, the function disappears from the graph.
8 Do one of the following:
Close the Modify Graph dialog box.
Keep the Modify Graph dialog box open to continue modifying the graph.
To change the color of functions
1 Open an image.
2 Delineate a VOI on the image.
3 Generate an intensity profile (refer to [MIPAV_Analysis.html#1082499 "Generating graphs" on page 325]).
Either the Contour VOI Graph window ([MIPAV_Analysis.html#1039942 Figure 204 on page 325]) or the Intensity Graph window ([MIPAV_Analysis.html#1038580 Figure 205 on page 329]) opens.
4 Select Views > Modify Graph Features in either the Contour VOI Graph window or the Intensity Graph window.
The Modify Graph dialog box ([MIPAV_Analysis.html#1361809 Figure 207 on page 332]) opens.
5 Select the Functions tab. The Functions page ([MIPAV_Analysis.html#1046698 Figure 217]) appears.
6 Do one of the following:
To change the color of the function, select Change Function N color. A check mark appears in the check box.
To keep the color the same, clear Change Function N color. The check mark disappears from the check box.
7 Click Apply.
If you selected Change Function N color, the function appears in the new color.
If you cleared Change Function N color, the color of the function remains the current color.
8 Do one of the following:
Close the Modify Graph dialog box.
Keep the Modify Graph dialog box open to continue modifying the graph.
To reset functions to their original colors
To return the functions on either the intensity graph or the contour VOI graph back to their default colors, select Views > Reset Graph to Original or press Ctrl Z in the Intensity Graph window or the Contour VOI Graph window as appropriate.
Modifying functions on graphs
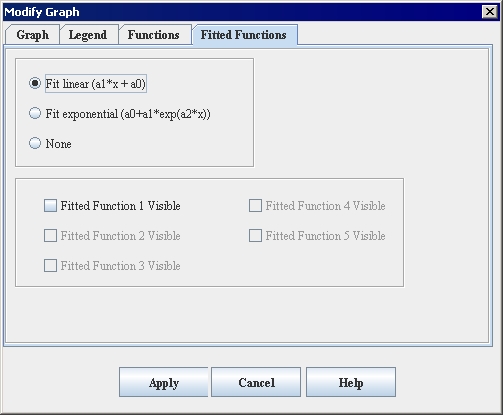
The graph modifying or fitting is designed for fitting of statistical functions used in parameters' evaluation. Available functions are currently various statistical functions with linear or exponential autocorrelation functions. In the Fitted Functions tab, you can select the autocorrelation function and then fit the data.
As the result you will obtain the fitted curve and the set of its parameters. The fit report will appear in the Fitting Data tab and can be saved into a file using Save Messages button.
Figure 219. Fitted Functions page in the Modify Graph dialog boxÂ
|
Fitted functions
|
|
Fit linear
|
Use the linear autocorrelation function (a1*x a0).
|
{| align="center"
|
|
|-
|
Fit exponential
|
Use the exponential autocorrelation function.
|-
|
None
|
Do not use the autocorrelation function.
|-
|
Fitted function N visible
|
If checked, adds the fitted curve to the graph. If this is not desirable, uncheck the box.
|-
|
Apply
| rowspan="1" colspan="2" |
Applies the parameters that you specified.
|-
|
Cancel
| rowspan="1" colspan="2" |
Disregards any changes that you made in this dialog box and closes the dialog box.
|-
|
Help
| rowspan="1" colspan="2" |
Displays online help for this dialog box.
|}
Select File > Close Graph in either the Contour VOI Graph window or in the Intensity Graph window, or press Ctrl X. The graph closes.


