|
|
| Line 10: |
Line 10: |
| | | | |
| | == Calculating statistics for contoured VOIs == | | == Calculating statistics for contoured VOIs == |
| | + | Once you have contoured structures, you can generate statistics on the VOI.<br /> |
| | | | |
| − | <div style="font-style: normal; font-weight: normal; margin-bottom: 6pt; margin-left: 0pt; margin-right: 0pt; margin-top: 0pt; text-align: left; text-decoration: none; text-indent: 0pt; text-transform: none; vertical-align: baseline"><font color="#000000"> Once you have contoured structures, you can generate statistics on the VOI.<br /></font></div><div style="font-style: normal; font-weight: normal; margin-bottom: 0pt; margin-left: 0pt; margin-right: 0pt; margin-top: 0pt; text-align: left; text-decoration: none; text-indent: 0pt; text-transform: none; vertical-align: baseline"><font color="#000000"> <br /></font></div><div style="font-style: normal; margin-bottom: 6pt; margin-left: 0pt; margin-right: 0pt; margin-top: 14pt; text-align: left; text-decoration: none; text-indent: 0pt; text-transform: none; vertical-align: baseline">'''<font color="#000000"> To select the type of statistics to calculate for a single VOI<br /></font>'''</div><div style="font-style: normal; font-weight: normal; margin-bottom: 0pt; margin-left: 18pt; margin-right: 0pt; margin-top: 6pt; text-align: left; text-decoration: none; text-indent: -18pt; text-transform: none; vertical-align: baseline"><font color="#000000"> 1 Open an image.<br /></font></div><div style="font-style: normal; font-weight: normal; margin-bottom: 0pt; margin-left: 18pt; margin-right: 0pt; margin-top: 6pt; text-align: left; text-decoration: none; text-indent: -18pt; text-transform: none; vertical-align: baseline"><font color="#000000"> 2 Contour a VOI. An example of a contoured VOI is shown below (Figure 1).<br /></font></div><div style="font-style: normal; font-weight: normal; margin-bottom: 0pt; margin-left: 18pt; margin-right: 0pt; margin-top: 6pt; text-align: left; text-decoration: none; text-indent: -18pt; text-transform: none; vertical-align: baseline"><font color="#000000"> 3 Select the VOI.<br /></font></div><div style="font-style: normal; font-weight: normal; margin-bottom: 0pt; margin-left: 18pt; margin-right: 0pt; margin-top: 6pt; text-align: left; text-decoration: none; text-indent: -18pt; text-transform: none; vertical-align: baseline"><font color="#000000"> 4 Do one of the following:<br /></font></div><div style="font-style: normal; font-weight: normal; margin-bottom: 0pt; margin-left: 36pt; margin-right: 0pt; margin-top: 6pt; text-align: left; text-decoration: none; text-indent: -12pt; text-transform: none; vertical-align: baseline"><font color="#000000"> Select VOI > Properties.<br /></font></div><div style="font-style: normal; font-weight: normal; margin-bottom: 0pt; margin-left: 36pt; margin-right: 0pt; margin-top: 6pt; text-align: left; text-decoration: none; text-indent: -12pt; text-transform: none; vertical-align: baseline"><font color="#000000"> Right-click inside the VOI, which automatically selects it. Then select Properties on the menu (Figure 1). <br /></font></div><div style="font-style: normal; font-weight: normal; margin-bottom: 0pt; margin-left: 18pt; margin-right: 0pt; margin-top: 6pt; text-align: left; text-decoration: none; text-indent: 0pt; text-transform: none; vertical-align: baseline"><font color="#000000"> The VOI Statistics dialog box (Figure 2) opens.<br /></font></div><div style="font-style: normal; font-weight: normal; margin-bottom: 0pt; margin-left: 18pt; margin-right: 0pt; margin-top: 6pt; text-align: left; text-decoration: none; text-indent: -18pt; text-transform: none; vertical-align: baseline"><font color="#000000"> 5 Choose the types of statistics that you want the program to calculate by selecting the appropriate check boxes in the Statistics to calculate group. <br /></font></div><div style="font-style: normal; font-weight: normal; margin-bottom: 0pt; margin-left: 18pt; margin-right: 0pt; margin-top: 6pt; text-align: left; text-decoration: none; text-indent: 0pt; text-transform: none; vertical-align: baseline"><font color="#000000"> Refer to Figure 2 for information on each statistic you can select. <br /></font></div><div style="font-style: normal; font-weight: normal; margin-bottom: 0pt; margin-left: 0pt; margin-right: 0pt; margin-top: 0pt; text-align: left; text-decoration: none; text-indent: 0pt; text-transform: none; vertical-align: baseline"><font color="#000000"> <br /></font></div><div style="font-style: normal; font-weight: normal; margin-bottom: 0pt; margin-left: 0pt; margin-right: 0pt; margin-top: 0pt; text-align: left; text-decoration: none; text-indent: 0pt; text-transform: none; vertical-align: baseline"><font color="#000000"> <br /></font></div><div style="font-style: normal; font-weight: normal; margin-bottom: 0pt; margin-left: 18pt; margin-right: 0pt; margin-top: 6pt; text-align: left; text-decoration: none; text-indent: -18pt; text-transform: none; vertical-align: baseline"><font color="#000000"> 6 Click Calculate. <br /></font></div><div style="font-style: normal; font-weight: normal; margin-bottom: 0pt; margin-left: 0pt; margin-right: 0pt; margin-top: 0pt; text-align: left; text-decoration: none; text-indent: 0pt; text-transform: none; vertical-align: baseline"><font color="#000000">
| + | '''To select the type of statistics to calculate for a single VOI'''<br /> |
| | + | 1 Open an image.<br /> |
| | + | 2 Contour a VOI. An example of a contoured VOI is shown below (Figure 1).<br /> |
| | + | 3 Select the VOI.<br /> |
| | + | 4 Do one of the following:<br /> |
| | + | Select VOI > Properties.<br /> |
| | + | Right-click inside the VOI, which automatically selects it. Then select Properties on the menu (Figure 1). <br /> |
| | + | The VOI Statistics dialog box (Figure 2) opens.<br /> |
| | + | 5 Choose the types of statistics that you want the program to calculate by selecting the appropriate check boxes in the Statistics to calculate group. <br /> |
| | + | Refer to Figure 2 for information on each statistic you can select. <br /> |
| | + | 6 Click Calculate. <br /> |
| | | | |
| | {| border="1" cellpadding="5" | | {| border="1" cellpadding="5" |
| − | |+ <div style="font-style: normal; margin-bottom: 3pt; margin-left: 0pt; margin-right: 0pt; margin-top: 9pt; text-align: left; text-decoration: none; text-indent: 0pt; text-transform: none; vertical-align: baseline">'''<font color="#000000"> Figure 1. VOI properties context menu<br /></font>'''</div> | + | |+ '''Figure 1. VOI properties context menu''' |
| | |- | | |- |
| | | | | | |
| Line 123: |
Line 134: |
| | |} | | |} |
| | | | |
| − | </div><div style="font-style: normal; font-weight: normal; margin-bottom: 0pt; margin-left: 0pt; margin-right: 0pt; margin-top: 0pt; text-align: left; text-decoration: none; text-indent: 0pt; text-transform: none; vertical-align: baseline"><font color="#000000"> <br /></font></div><div style="font-style: normal; font-weight: normal; margin-bottom: 0pt; margin-left: 0pt; margin-right: 0pt; margin-top: 0pt; text-align: left; text-decoration: none; text-indent: 0pt; text-transform: none; vertical-align: baseline"><font color="#000000"> <br /></font></div><div style="font-style: normal; font-weight: normal; margin-bottom: 0pt; margin-left: 0pt; margin-right: 0pt; margin-top: 0pt; text-align: left; text-decoration: none; text-indent: 0pt; text-transform: none; vertical-align: baseline"><font color="#000000"> <br /></font></div><div style="font-style: normal; font-weight: normal; margin-bottom: 0pt; margin-left: 0pt; margin-right: 0pt; margin-top: 0pt; text-align: left; text-decoration: none; text-indent: 0pt; text-transform: none; vertical-align: baseline"><font color="#000000"> <br /></font></div><div style="font-style: normal; font-weight: normal; margin-bottom: 0pt; margin-left: 0pt; margin-right: 0pt; margin-top: 0pt; text-align: left; text-decoration: none; text-indent: 0pt; text-transform: none; vertical-align: baseline"><font color="#000000"> <br /></font></div><div style="font-style: normal; font-weight: normal; margin-bottom: 0pt; margin-left: 0pt; margin-right: 0pt; margin-top: 0pt; text-align: left; text-decoration: none; text-indent: 0pt; text-transform: none; vertical-align: baseline"><font color="#000000"> <br /></font></div><div style="font-style: normal; margin-bottom: 6pt; margin-left: 0pt; margin-right: 0pt; margin-top: 14pt; text-align: left; text-decoration: none; text-indent: 0pt; text-transform: none; vertical-align: baseline">'''<font color="#000000"> To view the statistics for a single VOI<br /></font>'''</div><div style="font-style: normal; font-weight: normal; margin-bottom: 0pt; margin-left: 18pt; margin-right: 0pt; margin-top: 6pt; text-align: left; text-decoration: none; text-indent: -18pt; text-transform: none; vertical-align: baseline"><font color="#000000"> 1 Select the Output window.<br /></font></div><div style="font-style: normal; font-weight: normal; margin-bottom: 0pt; margin-left: 18pt; margin-right: 0pt; margin-top: 6pt; text-align: left; text-decoration: none; text-indent: -18pt; text-transform: none; vertical-align: baseline"><font color="#000000"> 2 Select the Data tab on the Output window to view the information. The Data page of the Output window (Figure 3) appears showing the results of the calculations.<br /></font></div><div style="font-style: normal; font-weight: normal; margin-bottom: 0pt; margin-left: 0pt; margin-right: 0pt; margin-top: 0pt; text-align: left; text-decoration: none; text-indent: 0pt; text-transform: none; vertical-align: baseline"><font color="#000000"> <br /></font></div><div style="font-style: normal; font-weight: normal; margin-bottom: 0pt; margin-left: 0pt; margin-right: 0pt; margin-top: 0pt; text-align: left; text-decoration: none; text-indent: 0pt; text-transform: none; vertical-align: baseline"><font color="#000000"> <br /></font></div><div style="font-style: normal; font-weight: normal; margin-bottom: 0pt; margin-left: 0pt; margin-right: 0pt; margin-top: 0pt; text-align: left; text-decoration: none; text-indent: 0pt; text-transform: none; vertical-align: baseline"><font color="#000000"> <br /></font></div><div style="font-style: normal; font-weight: normal; margin-bottom: 0pt; margin-left: 0pt; margin-right: 0pt; margin-top: 0pt; text-align: left; text-decoration: none; text-indent: 0pt; text-transform: none; vertical-align: baseline"><font color="#000000"> <br /></font></div><div style="font-style: normal; margin-bottom: 6pt; margin-left: 0pt; margin-right: 0pt; margin-top: 14pt; text-align: left; text-decoration: none; text-indent: 0pt; text-transform: none; vertical-align: baseline">'''<font color="#000000"> To save the statistics for a single VOI<br /></font>'''</div><div style="font-style: normal; font-weight: normal; margin-bottom: 0pt; margin-left: 18pt; margin-right: 0pt; margin-top: 6pt; text-align: left; text-decoration: none; text-indent: -18pt; text-transform: none; vertical-align: baseline"><font color="#000000"> 1 Select File > Save Messages in the Output window. <br /></font></div><div style="font-style: normal; font-weight: normal; margin-bottom: 0pt; margin-left: 18pt; margin-right: 0pt; margin-top: 6pt; text-align: left; text-decoration: none; text-indent: 0pt; text-transform: none; vertical-align: baseline"><font color="#000000"> The Save dialog box opens.<br /></font></div><div style="font-style: normal; font-weight: normal; margin-bottom: 0pt; margin-left: 18pt; margin-right: 0pt; margin-top: 6pt; text-align: left; text-decoration: none; text-indent: -18pt; text-transform: none; vertical-align: baseline"><font color="#000000"> 2 Specify a name for the messages file and select a location for storing it. <br /></font></div><div style="font-style: normal; font-weight: normal; margin-bottom: 0pt; margin-left: 18pt; margin-right: 0pt; margin-top: 6pt; text-align: left; text-decoration: none; text-indent: -18pt; text-transform: none; vertical-align: baseline"><font color="#000000"> 3 Click Save. The software saves the file and places it in the specified location.<br /></font></div><div style="font-style: normal; font-weight: normal; margin-bottom: 0pt; margin-left: 0pt; margin-right: 0pt; margin-top: 5pt; text-align: left; text-decoration: none; text-indent: 0pt; text-transform: none; vertical-align: baseline"><font color="#000000"> <span style="font-style: normal; text-decoration: none; text-transform: none; vertical-align: baseline">'''<font color="#000000">Tip:</font>'''</span> MIPAV provides you with the ability to type directly onto the Data page. So, for example, you could add a description of when the statistics were calculated or any other such meaningful information (Figure 3).<br /></font></div><div style="font-style: normal; font-weight: normal; margin-bottom: 0pt; margin-left: 0pt; margin-right: 0pt; margin-top: 0pt; text-align: left; text-decoration: none; text-indent: 0pt; text-transform: none; vertical-align: baseline"><font color="#000000"> <br /></font></div><div style="font-style: normal; font-weight: normal; margin-bottom: 0pt; margin-left: 0pt; margin-right: 0pt; margin-top: 0pt; text-align: left; text-decoration: none; text-indent: 0pt; text-transform: none; vertical-align: baseline"><font color="#000000"> <br /></font></div><div style="font-style: normal; font-weight: normal; margin-bottom: 0pt; margin-left: 0pt; margin-right: 0pt; margin-top: 0pt; text-align: left; text-decoration: none; text-indent: 0pt; text-transform: none; vertical-align: baseline"><font color="#000000"> <br /></font></div><div style="font-style: normal; font-weight: normal; margin-bottom: 0pt; margin-left: 0pt; margin-right: 0pt; margin-top: 0pt; text-align: left; text-decoration: none; text-indent: 0pt; text-transform: none; vertical-align: baseline"><font color="#000000"> <br /></font></div><div style="font-style: normal; font-weight: normal; margin-bottom: 0pt; margin-left: 0pt; margin-right: 0pt; margin-top: 0pt; text-align: left; text-decoration: none; text-indent: 0pt; text-transform: none; vertical-align: baseline"><font color="#000000"> <br /></font></div><div style="font-style: normal; font-weight: normal; margin-bottom: 0pt; margin-left: 0pt; margin-right: 0pt; margin-top: 0pt; text-align: left; text-decoration: none; text-indent: 0pt; text-transform: none; vertical-align: baseline"><font color="#000000"> <br /></font></div><div style="font-style: normal; font-weight: normal; margin-bottom: 0pt; margin-left: 0pt; margin-right: 0pt; margin-top: 0pt; text-align: left; text-decoration: none; text-indent: 0pt; text-transform: none; vertical-align: baseline"><font color="#000000"> <br /></font></div><div style="font-style: normal; font-weight: normal; margin-bottom: 0pt; margin-left: 0pt; margin-right: 0pt; margin-top: 0pt; text-align: left; text-decoration: none; text-indent: 0pt; text-transform: none; vertical-align: baseline"><font color="#000000">
| + | '''To view the statistics for a single VOI'''<br /> |
| | + | 1 Select the Output window.<br /> |
| | + | 2 Select the Data tab on the Output window to view the information. The Data page of the Output window (Figure 3) appears showing the results of the calculations.<br /> |
| | + | |
| | + | '''To save the statistics for a single VOI'''<br /> |
| | + | 1 Select File > Save Messages in the Output window. <br /> |
| | + | The Save dialog box opens.<br /> |
| | + | 2 Specify a name for the messages file and select a location for storing it. <br /> |
| | + | 3 Click Save. The software saves the file and places it in the specified location.<br /> |
| | + | '''Tip:''' MIPAV provides you with the ability to type directly onto the Data page. So, for example, you could add a description of when the statistics were calculated or any other such meaningful information (Figure 3).<br /> |
| | | | |
| | {| border="1" cellpadding="5" | | {| border="1" cellpadding="5" |
| − | |+ <div style="font-style: normal; margin-bottom: 3pt; margin-left: 0pt; margin-right: 0pt; margin-top: 9pt; text-align: left; text-decoration: none; text-indent: 0pt; text-transform: none; vertical-align: baseline">'''<font color="#000000"> Figure 3. Data page in the Output window showing statistics <br /></font>'''</div> | + | |+ '''Figure 3. Data page in the Output window showing statistics ''' |
| | |- | | |- |
| | | | | | |
| Line 132: |
Line 152: |
| | |} | | |} |
| | | | |
| − | <br /></font></div>
| |
| | | | |
| | [[Calculating statistics on VOI groups]] | | [[Calculating statistics on VOI groups]] |
In this chapter . . .
You can use MIPAV to generate statistics on contoured volume of interest (VOI) regions and to calculate the volume of painted pixels and voxels. You can also use MIPAV's algorithms to perform more sophisticated image analysis. For information about algorithms, refer to Volume 2, Algorithms.
Once you have contoured structures, you can generate statistics on the VOI.
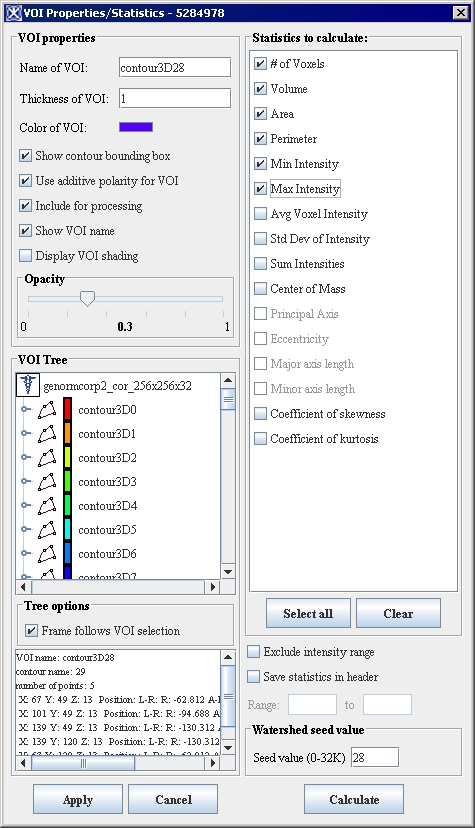
Figure 2. VOI Statistics dialog box
|
Name of VOI
|
Indicates the color of the VOI outlines and the name of the VOI. To use this to group two contours, refer to Chapter 7 for more details.
|
|
|
Show bounding box
|
Indicates whether to show the bounding box. If this check box is selected, the bounding box appears around the VOI.
|
|
Use Additive polarity for VOI
|
TBD.
|
|
Include for processing
|
Indicates whether to include the VOI in the processing when running an algorithm. If selected, the VOI is included.
|
|
Boundary or blended
|
Indicates whether the contour is filled with color (blended) or transparent (only the boundary appears). If selected, the VOI is filled with color.
|
|
Opacity
|
Indicates whether a VOI that is filled with color is transparent, translucent, and opaque: 0 is transparent, and 1 is opaque.
|
|
Statistics to calculate
|
# of voxels-Indicates the number of voxels, including voxels that span frames in an image stack, that are enclosed in the VOI.
|
|
|
Volume-Measures the amount of space occupied by a 3D VOI. To calculate the volume, the software multiplies the number of pixels by the resolution of each dimension. Area-Measures the surface of the VOI. To calculate the area, the software multiples the number of pixels by the resolutions of the x and y dimensions. Perimeter - measures a perimeter of VOI. Min. Intensity - shows the min voxel intestacy. Max. Intensity - shows the max voxel intensity. Average voxel intensity-Calculates the average intensity of the voxels in the VOI by adding the intensity of all voxels in the VOI and dividing the result by the sum of the voxels. Std. dev. of voxel intensity-Calculates the standard deviation of the intensity of the voxels in the VOI. Center of mass-Indicates the point at which the whole mass of the VOI is concentrated. It is calculated as the sum of all x coordinates divided by the number of points and the sum of all y coordinates divided by the number of points. Principal axis (only 2D)-Calculates the principal axis for 2D images only. Eccentricity (only 2D)-Describes the geometric shape of the VOI as an ellipse, with 0 indicating a circle and 1 indicating a straight line. Major axis length - calculates the length of the major axis for an elliptical VOI. Minor axis length - calculates the length of the minor axis for an elliptical VOI.
|
| Clear
|
Clears all of the statistical measures in Statistics to calculate.
|
| Select all
|
Selects all of the statistical measures in Statistics to calculate.
|
|
Exclude intensity range
|
Excludes a specific range of intensity values, which you specify in the Range boxes, in the calculation. When this check box is selected, the Range boxes become available.
|
|
Range
|
Specifies a particular range of intensities to exclude from the calculations. These boxes become available only when the Exclude intensity range check box is selected.
|
|
Watershed seed value (0-32K)
|
Indicates the watershed seed value.
|
|
Apply
|
Applies the changes you made to this dialog box.
|
|
Cancel
|
Disregards any changes you made in this dialog box and closes the dialog box.
|
|
Calculate
|
Runs all selected statistics according to the specifications in this dialog box.
|
|
Help
|
Displays online help for this dialog box.
|
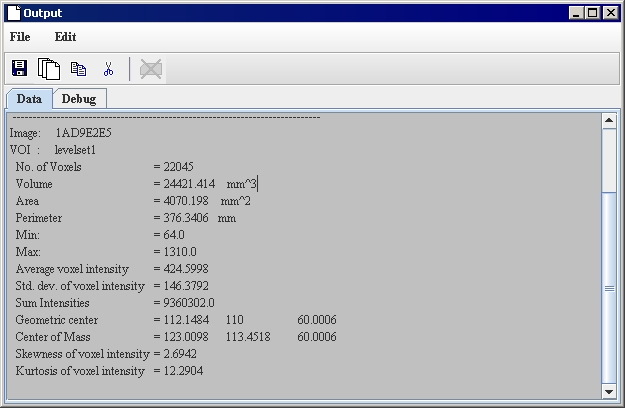
To view the statistics for a single VOI
1 Select the Output window.
2 Select the Data tab on the Output window to view the information. The Data page of the Output window (Figure 3) appears showing the results of the calculations.
To save the statistics for a single VOI
1 Select File > Save Messages in the Output window.
The Save dialog box opens.
2 Specify a name for the messages file and select a location for storing it.
3 Click Save. The software saves the file and places it in the specified location.
Tip: MIPAV provides you with the ability to type directly onto the Data page. So, for example, you could add a description of when the statistics were calculated or any other such meaningful information (Figure 3).
Figure 3. Data page in the Output window showing statistics
|
|
Calculating statistics on VOI groups


